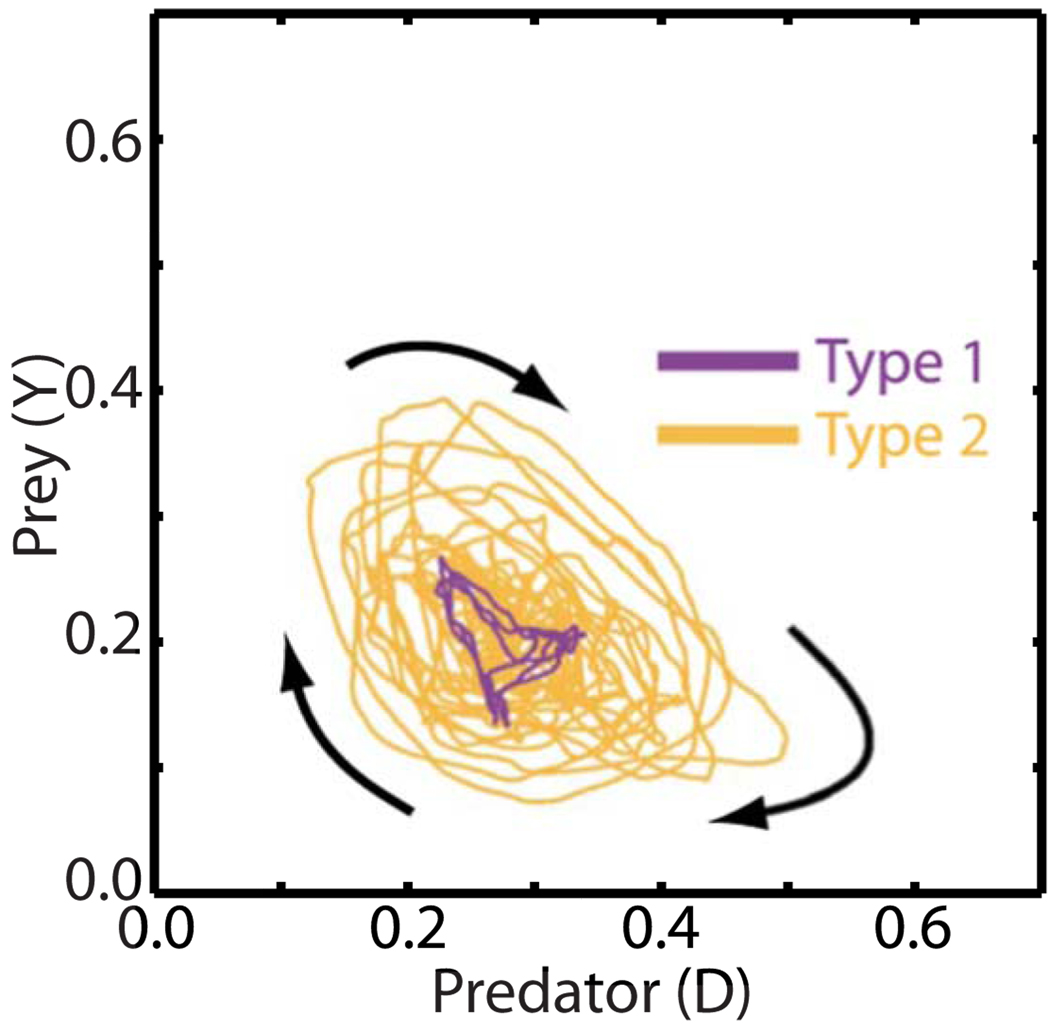
FIG. 4.
(Color online) Typical trajectories in predator-prey phase space during type-1 (purple) and type-2 (orange) behavior. The arrows show the dominant sense of rotation for the trajectories shown. The predator and prey data shown in Figs. 2(a) and 3(a) are short segments of the data used to produce the type-1 and type-2 trajectories, respectively, shown here.

