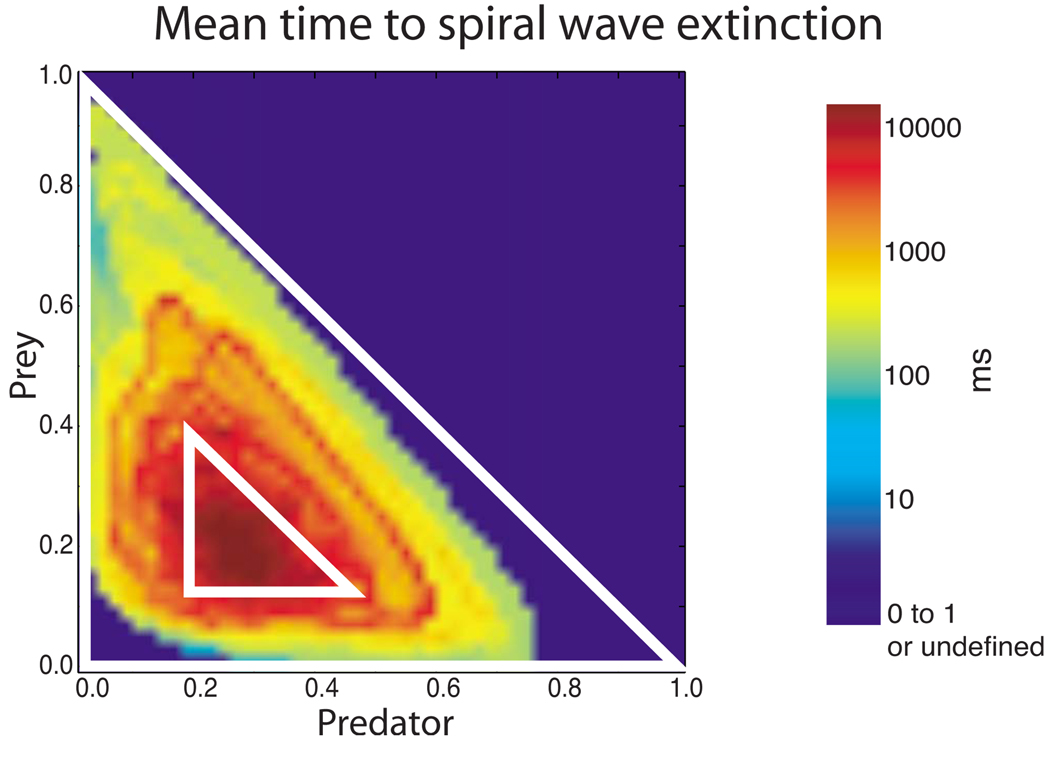
FIG. 7.
(Color online) Mean time to extinction (in ms) as a function of current location in predator-prey phase space. The data used for the calculation were taken from the 48 3V-SIM simulations with identical parameters and randomized starts for the initial spiral wave, as described in the Methods section (Sec. II). Regions I (smaller triangle) and II (larger triangle) from Fig. 5 are shown for reference.

