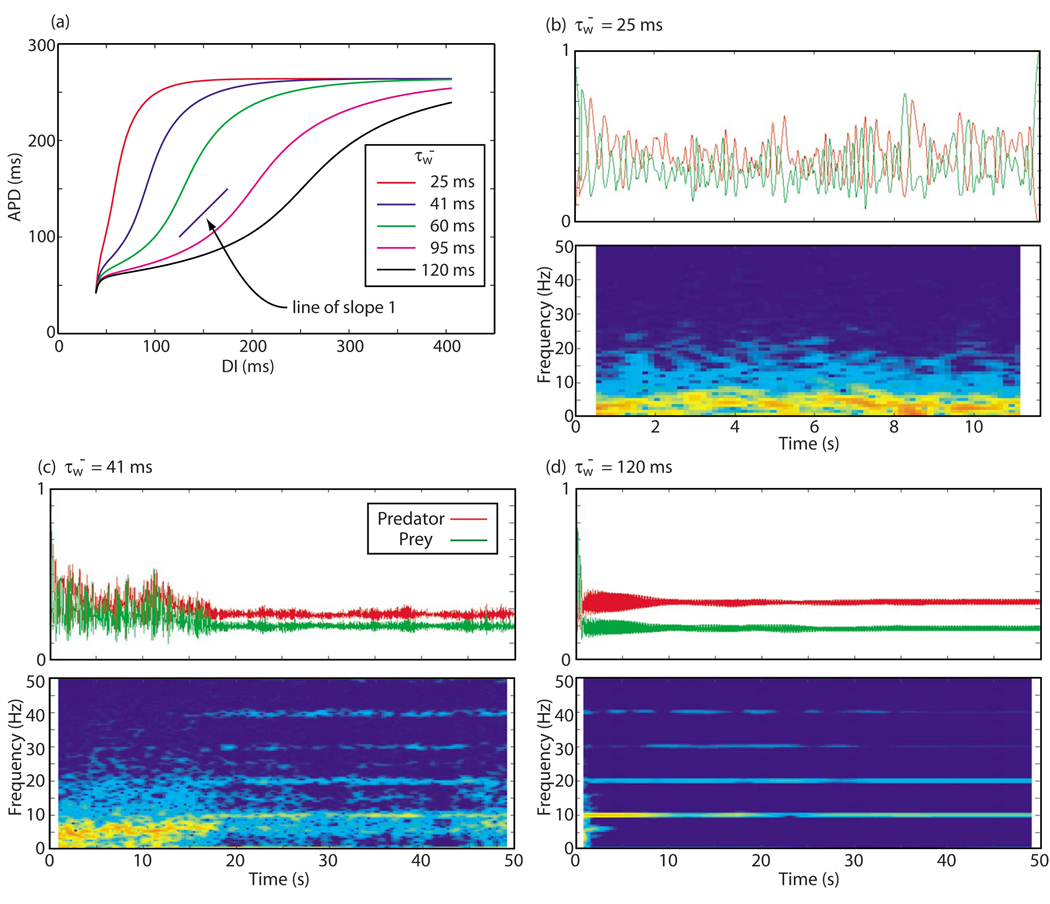
FIG. 9.
(Color online) Behavior of the predator and prey quantities for APD restitution curves with different slopes. (a) The APD-DI restitution curves for 3V-SIM dynamics for five different values of the parameter . A line of slope 1 is shown for reference. The remaining panels show the predator and prey histories and predator power spectrum vs time for three of these restitution curves: (b) , (c) , and (d) , from 15-by-15 cm 3V-SIM simulations.

