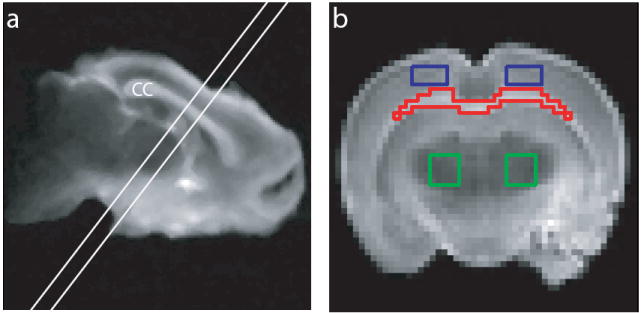
Fig. 1.

(a) Sample T2-weighted fast spin-echo coronal image, identifying a 1.5-mm slice orthogonal to the corpus callosum (cc) for T1–T2 measurements. The image was median-filtered for display purposes. (b) Resultant 1.5-mm slice from (a), identifying sample ROIs used for T1–T2 analysis. Shown are ROIs for corpus callosum (red), cortical grey matter (blue), and sub-cortical grey matter (green). Signal from contralateral ROIs in grey matter were summed prior to spectral analysis.
