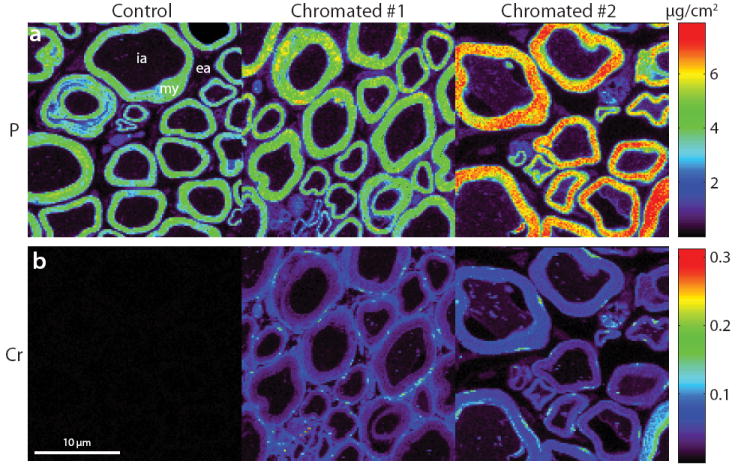
Fig. 6.

μXRF data from one control and two chromated frog sciatic nerve samples. Shown are maps of P (a) and Cr (b). In the P maps, note the abundance of P in myelin, which was exploited to manually segment these images into myelin (my), intra-axonal (ia), and extra-axonal (ea) compartments. In the Cr maps, note the high concentration of Cr in myelin (and the extra-axonal space in chromated #1) relative to the intra-axonal space in the chromated samples and the lack of Cr in the control sample.
