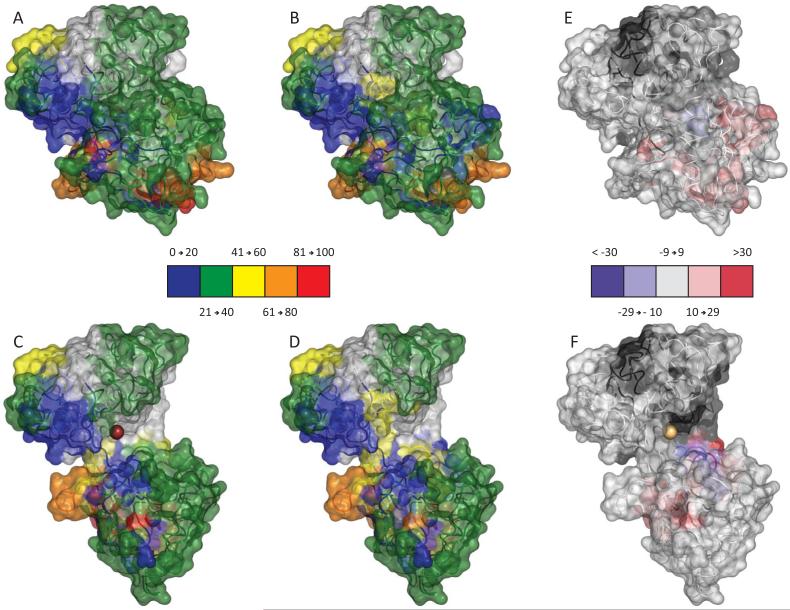
Figure 5.
Structural Flexi-Map pH 5.5. Data from the 5 minute time point were mapped to both the closed (top) and open (bottom) crystal structures and colored according the legends. To readily compare HDX between the Holo sample (A and C) and the Apo sample (B and D), the difference in % exchange (Holo – Apo) is also shown (E and F).

