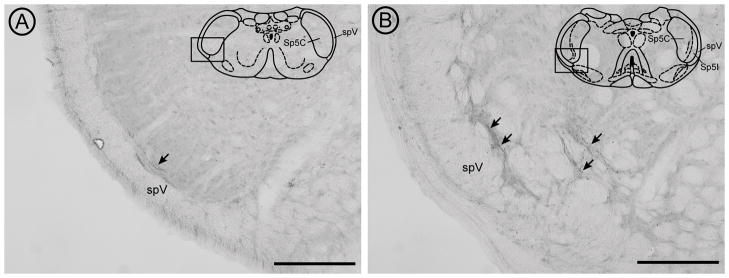
Figure 1.
Light micrographs show the distribution of peroxidase-labeled CTb-containing corneal afferents (arrows) at the caudal (A) and rostral (B) boundaries of ventrolateral Vc (diagram insets). The black box on each diagram delineates the ventrolateral regions of Vc/C1 (A) and Vi/Vc (B) that were imaged for analysis. Representative diagrams of the caudal and rostral Vc regions are modified from the digital atlas of Paxinos and Watson (Paxinos and Watson, 1998) and reproduced here with permission from the publisher. The tissue was incubated in goat anti-CTb primary antibody (1:25,000; List Biological Laboratories, Inc.) as described in the Methods section. Bound primary antibody was visualized by incubating tissue sections in biotinylated horse anti-goat secondary antibody (1:400; Vector Laboratories, Inc., Burlingame, CA) followed by incubation in Avidin-Biotin (Elite Vectastain ABC kit; Vector) and then in diaminobenzidine-hydrogen peroxide solution. Tissue was mounted on gelatin-coated slides, dehydrated and then coverslipped with DPX mounting medium (Sigma). Images were taken with on an Olympus BX51 microscope equipped with a DP71 camera (Olympus America, Inc, Center Valley, PA) and were adjusted for optimal brightness and contrast using Adobe Photoshop (Adobe Systems Inc., San Jose, CA). Sp5C = spinal trigeminal subnucleus caudalis, Sp5I = spinal trigeminal subnucleus interpolaris, spV = spinal trigeminal tract. Scale bars = 200 μm.

