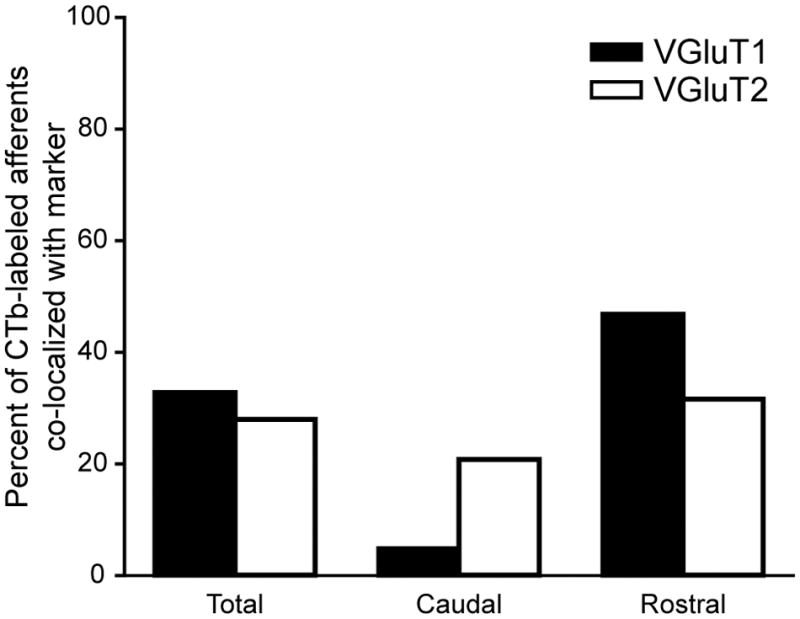
Figure 6.

The summary graph shows the percentages of CTb-labeled corneal afferents that also contained one of the VGluTs across five animals. The percentages in the Total columns represent the sum of VGluT1- or VGluT2-labeled corneal afferents in both caudal Vc/C1 and rostral Vi/Vc. We compared the proportions of VGluT1-containing to total CTb-labeled varicosities in Vc/C1 and Vi/Vc and found that there was a significant difference in this proportion between these two regions (z = 8.050, P < 0.001). There was also a significant difference in the proportions of VGluT2-containing to total CTb-labeled varicosites in Vc/C1 and Vi/Vc (z = 2.074, P = 0.038).
