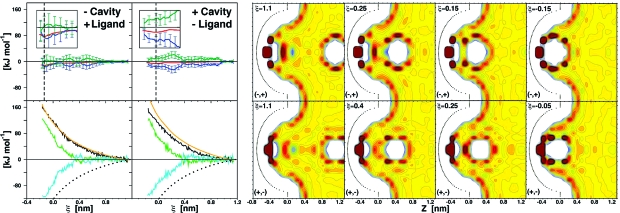
Figure 4.
Thermodynamic signature profiles and water density distribution maps along the (−,+) or (+,−) cavity−ligand binding coordinates. See Figure 2 legend for color coding. In addition, the left, bottom panels report as well the change of cavity−ligand interaction energy, UCL (dotted black). See Movies S4 and S5 for dynamic hydration.

