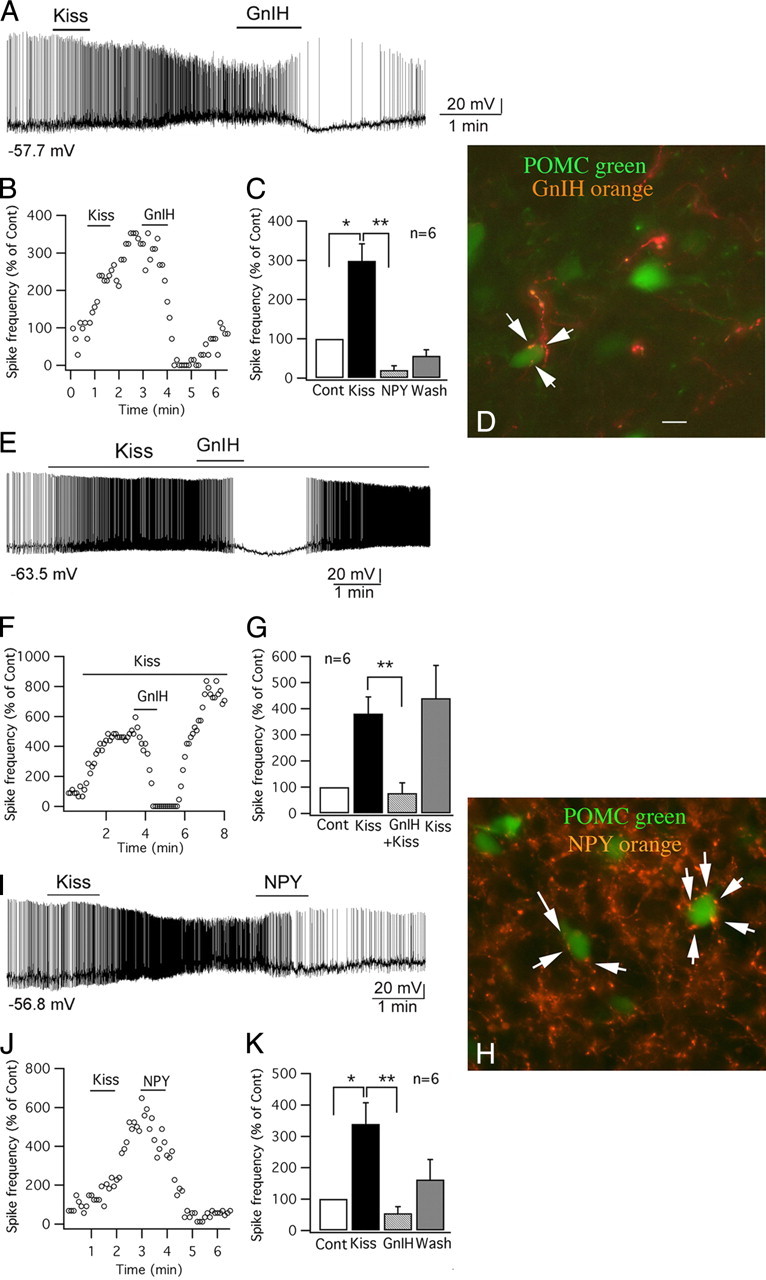
Figure 9.

GnIH and NPY inhibit the effect of kisspeptin on POMC cells. A, Trace showing that a POMC cell was excited by kisspeptin (1 μm), and the effect of kisspeptin was reduced by GnIH (1 μm), and instead the cell was hyperpolarized after GnIH (1 μm). B, Time course curve of the effect of kisspeptin and GnIH on spike frequency of the cell shown in trace in A. C, Bar graph showing the spike frequency changes in POMC cells with application of kisspeptin and GnIH (control, 100%; *p < 0.05 vs Cont, **p < 0.01 vs kisspeptin; n = 6; ANOVA). D, In this micrograph, POMC cells express GFP and are green, and axons containing GnIH are immunostained orange. The arrows indicate GnIH-immunoreactive axons and boutons terminating near or on POMC neurons. Scale bar, 12 μm. E, GnIH applied during kisspeptin application blocked the spike increase. On GnIH washout, the kisspeptin-increased spike frequency recovered. F, Time course of an example cell, similar to that shown in E. G, Bar graphs showing mean effect of kisspeptin, kisspeptin plus GnIH, and recovery in kisspeptin after GnIH washout (**p < 0.01 vs kisspeptin; n = 6; ANOVA). H, Orange NPY-immunoreactive axons and boutons (arrows) terminate near or on green POMC neurons. Scale bar, 12 μm. I, Trace showing that kisspeptin (1 μm) excited a POMC cell, and the excitation was reduced by NPY (1 μm). J, Time course of the effect of kisspeptin and NPY on spike frequency of the cell in trace I. K, Bar graph showing the spike frequency changes of POMC cells after applying kisspeptin and NPY (control, 100%; *p < 0.05 vs Cont, **p < 0.01 vs kisspeptin; n = 6; ANOVA). Error bars indicate SEM. The membrane potential values under the traces in A, E, and I indicate the membrane potential before applying kisspeptin.
