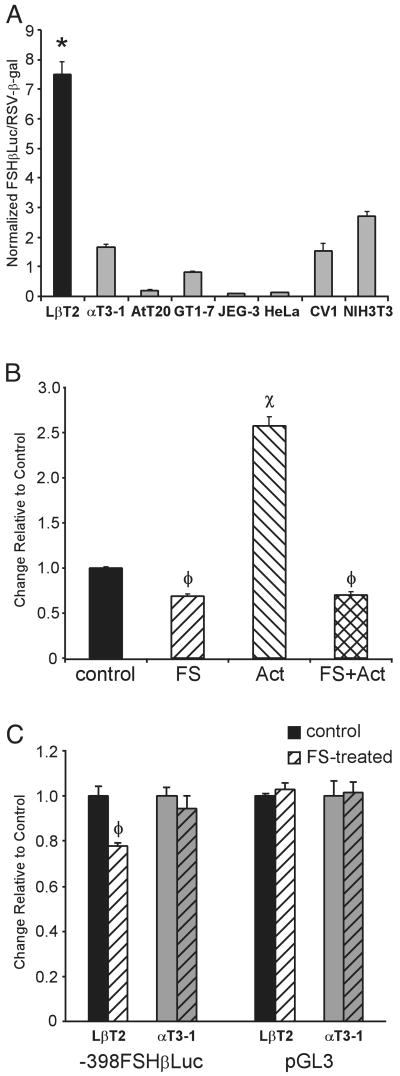
Fig. 2. The Mouse FSH β-Subunit Promoter Is Specifically Active and Responsive to Follistatin in LβT2 Cells.
A, The 398-bp mouse FSHβ promoter was linked to the luciferase reporter gene (−398FSHβLuc) and transiently transfected into pituitary-derived LβT2 (differentiated gonadotrope), αT3-1 (precursor gonadotrope), and AtT20 (corticotrope) cells and non-pituitary-derived GT1–7 (hypothalamic neuroendocrine), JEG-3 (placental), HeLa (cervical fibroblast), CV1 (kidney), and NIH3T3 (fibroblast) cells. RSV-β-gal was cotransfected as an internal control. To control for differences in transfection efficiencies and transcription rates between distinct cell lines, a parallel control, RSV-Luc, was transfected into each cell line with the RSV-β-gal internal control. The ratio of RSV-Luc divided by RSV-β-gal was set at 100 for each cell line (not shown). Results represent the mean ± sem of at least three independent experiments, each performed in triplicate (n ≥ 9). The bar marked with an asterisk (*) (LβT2 cells) is statistically significant from all other bars (P < 0.05). Statistically significant differences between other cell lines are not shown. B, The 398-bp mouse FSHβ promoter responds to follistatin and activin. LβT2 cells were transiently transfected with −398FSHβLuc, along with the RSV-β-gal internal control, and then treated with vehicle (control), 100 ng/ml follistatin (FS), 10 ng/ml activin (Act), or a combination of both follistatin and activin (FS+Act) for 24 h in DMEM with 10% fetal bovine serum. The value of the vehicle-treated sample was set at 1, and the follistatin- and activin-treated samples are shown relative to this control. Results represent the mean ± sem of three independent experiments, each performed in triplicate (n = 9). The bars marked with φ (FS and FS+Act) and x (Act) are statistically different from the untreated control and are also different from each other (P < 0.05). C, The mouse FSHβ promoter responds to follistatin in LβT2 cells, but not αT3-1 cells. LβT2 and αT3-1 cells were transiently transfected with either −398FSHβLuc or pGL3, along with the RSV-β-gal internal control, and then treated with either vehicle (control) or 100 ng/ml follistatin for 24 h (FS-treated, hatched bars). The values of the vehicle-treated samples were set at 1 and the FS-treated samples are shown relative to this control. Results represent the mean ± sem of at least three independent experiments, each performed in triplicate (n ≥ 9). The bar marked with φ is statistically different from the untreated control (P < 0.05).

