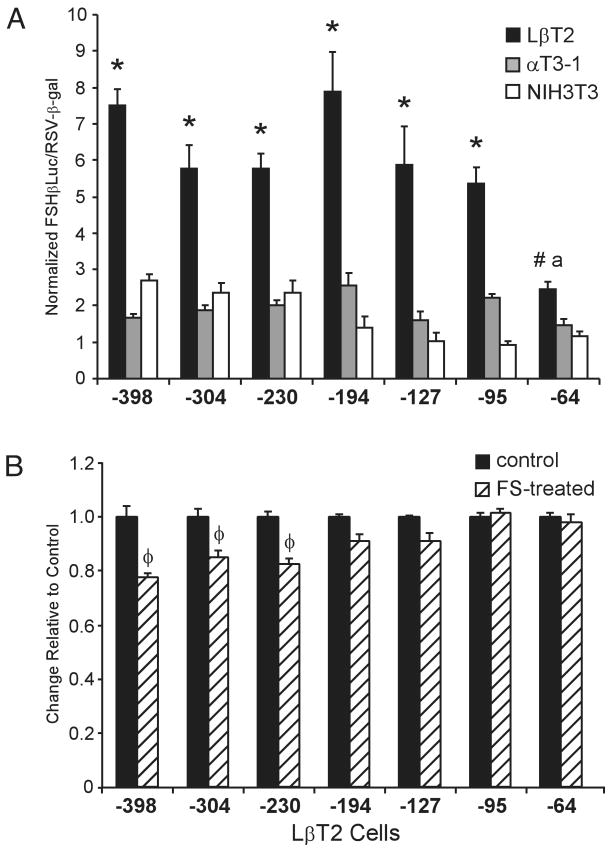
Fig. 3. Different Regions of the FSHβ Promoter Contribute to Basal Activity and Follistatin Responsiveness in LβT2 Cells.
A, Proximal promoter sequences are important for basal activity of the mouse FSHβ promoter. Truncations of the mouse FSHβ promoter linked to luciferase were transiently transfected into LβT2, αT3-1, and NIH3T3 cells. Results represent the mean ± sem of at least three independent experiments, each performed in triplicate (n ≥ 9). Asterisks (*) designate a statistically significant difference from αT3-1 and NIH3T3 cells (P < 0.05) # designates significant difference from NIH3T3 cells (P < 0.05) but not αT3-1 cells; the letter a designates a statistical difference between the −64-bp FSHβLuc truncation and all other truncations in LβT2 cells (P < 0.05). Statistical differences between αT3-1 and NIH3T3 cells are not shown. B, Follistatin responsiveness of the mouse FSHβ promoter is localized to a more distal region of the promoter. LβT2 cells were transiently transfected with mouse FSHβLuc truncations and treated with either vehicle (control) or 100 ng/ml follistatin for 24 h (FS-treated, hatched bars). To facilitate comparisons between promoter responses, the control samples were set at 1 and the FS-treated samples are shown relative to this control. Results represent the mean ± sem of at least three independent experiments, each performed in triplicate (n ≥ 9). Bars marked with φ are statistically different from the untreated controls (P < 0.05).

