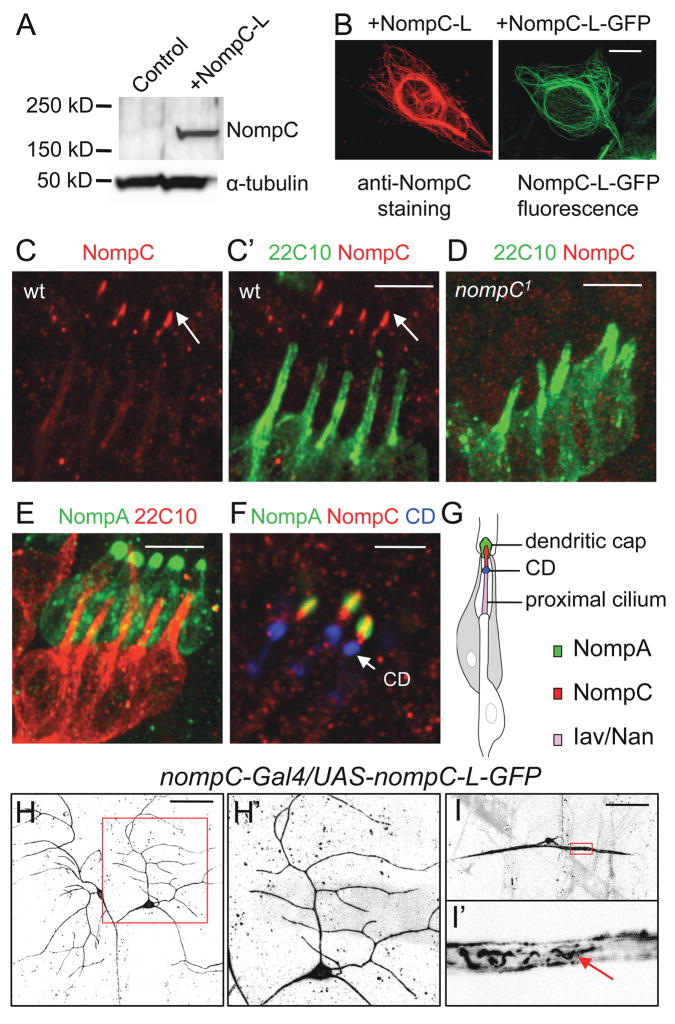
Figure 4. NompC distribution in embryonic and larval sensory neurons.
(A) Western blots with the NompC antibody in NompC-L-transfected HEK 293 cells.
(B) Immunostaining with the NompC antibody in NompC-L-transfected cells and GFP fluorescence in NompC-L-GFP-transfected cells. Scale bar, 10 μm.
(C, D) Co-staining of chordotonal organs (lch5) with the NompC antibody (red) and neural-specific cytoskeletal maker mAb 22C10 (green) in wild-type and nompC1 mutant embryos. Scale bar, 5 μm.
(E) In embryos expressing GFP-NompA, co-staining of GFP (green) and mAb 22C10 (red) marks the NompA-enriched dendritic caps. Scale bar, 5 μm.
(F) Co-staining of embryos expressing GFP-NompA (green) with mAb 21A6/anti-EYS (blue), a marker for the ciliary dilation (CD), and the NompC antibody (red). Scale bar, 3 μm.
(G) A schematic of a single chordotonal organ showing the localization of NompA in dendritic caps, NompC in distal ciliary tips and Iav/Nan in the proximal cilium.
(H, I) Localization of NompC-L-GFP in larval class I da neurons (H) and bd neurons (I). The arrow indicates NompC-L-GFP fluorescence in filamentous structures within the proximal dendrites. The boxed area in H and I is enlarged and shown in H′ and I′, respectively. Scale bar, 50 μm. See also Figure S3.

