
Figure 3.
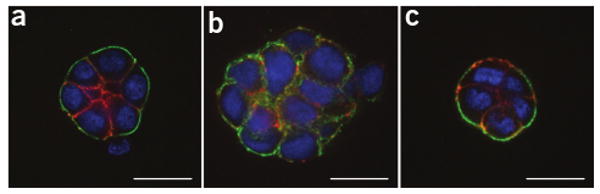
3D drug response assay. (a–c) HMT-3522 S1 (a), HMT-3522 T4-2 (b) and HMT-3522 T4-2 treated with an EGFR inhibitor, AG1478 (c) were cultured in the 3D on-top assay for 4 d. Colonies were then extracted and immunostained against α6 integrin (green) and β-catenin (red). Nuclei were counterstained with DAPI (blue). Confocal sections through the centers of the colonies are shown. Scale bar, 20 μm.