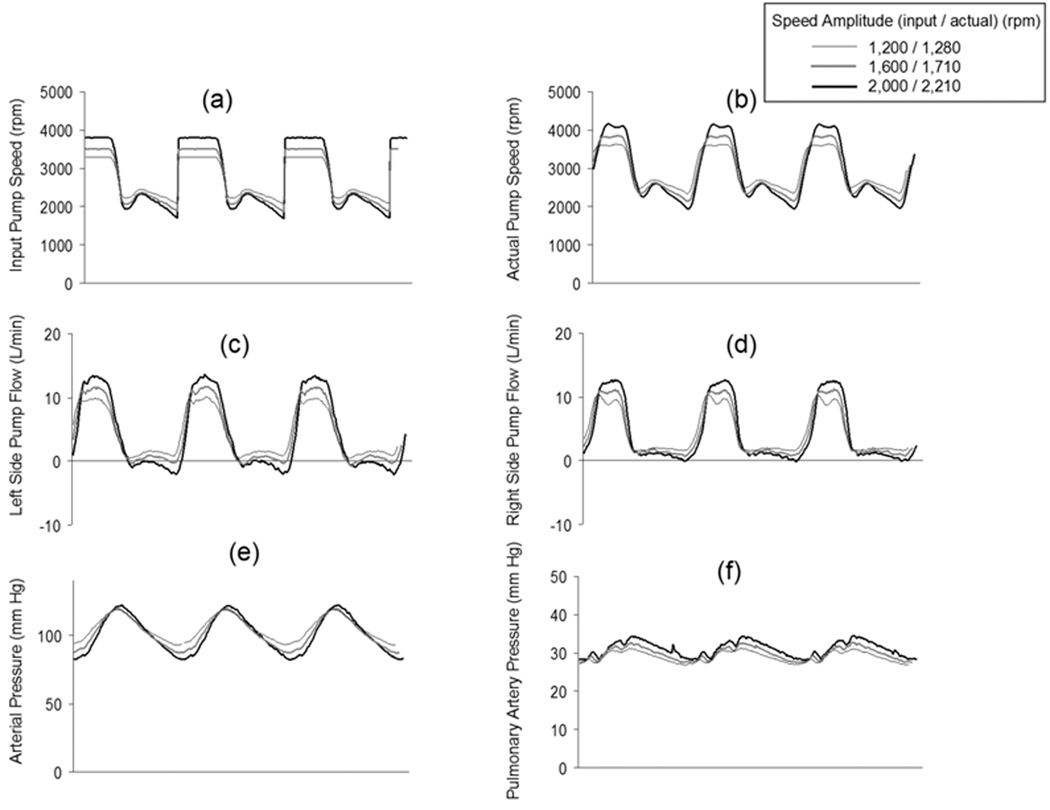
Figure 4.
The pump speed modulation control input designated as “Physiologic” (Figure 4a), the resulting actual pump speed (Figure 4b), the left side pump flow (Figure 4c), and the right side pump flow (Figure 4d) achieved to simulate a Physiologic systemic arterial pressure waveform (Figure 4e) and pulsatile pulmonary artery pressure waveform (Figure 4f) at three speed modulation amplitudes. All data displayed were collected at Baseline pump and hemodynamic conditions.

