Fig. 4.
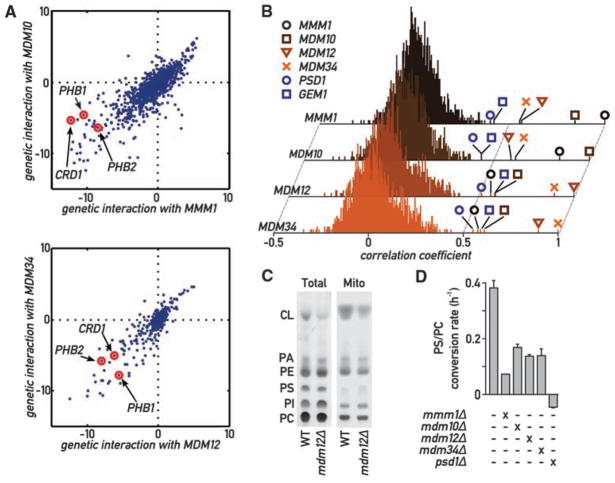
Global analysis of ERMES genetic interactions. (A) Genetic interactions of MMM1 and MDM10 (top) and of MDM12 and MDM34 (bottom). Positive values indicate epistatic or suppressive interactions (i.e., double mutant grows better than expected from the combination of the phenotypes of each single mutant); negative values indicate a synthetic sick/lethal genetic interaction (i.e., double mutant grows worse than expected). (B) Histograms of correlation coefficients generated by comparing the profiles of genetic interaction for each ERMES component to all other 1493 profiles in the E-MAP analysis. ERMES components display strongest correlation to each other and to GEM1 and PSD1. (C) Thin-layer chromatography (TLC) analysis of steady-state total and mitochondrial phospholipids in WT and mdm12Δ strains. PA, phosphatidic acid; PI, phosphatidylinositol. (D) The aminoglycerophospholipid biosynthesis pathway is slowed down in ERMES mutants. Cultures of the indicated genotypes were labeled with 14C-serine, then chased with an excess cold serine. The variation of the PC/PS ratio was then measured over time by quantitative TLC, and its slope was estimated with linear regression. Error bars represent the SE of the linear regression.

