
Fig. 5.
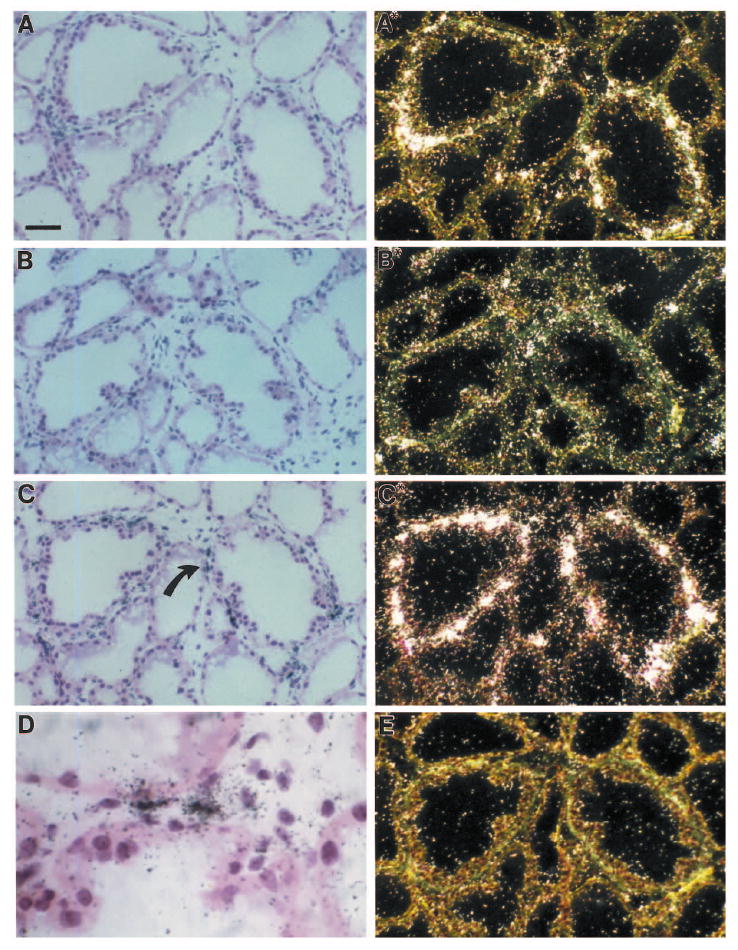
Distribution of gelatinase A, stromelysin-1 and uPA in 7-day lactating mouse mammary gland as detected by in situ hybridization. Higher magnification of the in situ hybridization shown in Fig. 4. The sections were hybridized by using antisense gelatinase A RNA (A,A*), antisense uPA (B,B*), antisense stromelysin-1 RNA (C,C*), or sense stromelysin-1 RNA (E) as described in Materials and Methods. Tissue sections were viewed by bright-field (A-D) or dark-field (A*,B*,C*,E) microscopy. Arrow in C indicates area shown at higher magnification in D. Positive control experiments were performed by application of two different antisense probes, covering nonoverlapping parts of each of the three cDNAs, as described in Materials and Methods. These probes were adjusted to the same specific activity and applied to adjacent sections of the mammary gland. In all cases, the two probes showed identical hybridization patterns for each specific mRNA (data not shown). As a negative control, sense RNA probes transcribed from each of the three cDNAs were applied to adjacent sections of all specimens, and in these sections no signal was obtained above background. In sections treated with RNase A before hybridization, no signal was detected with the antisense probes. A,A*,B,B*,C,C*,E, bar, 25 μm; D, bar, 5 μm.