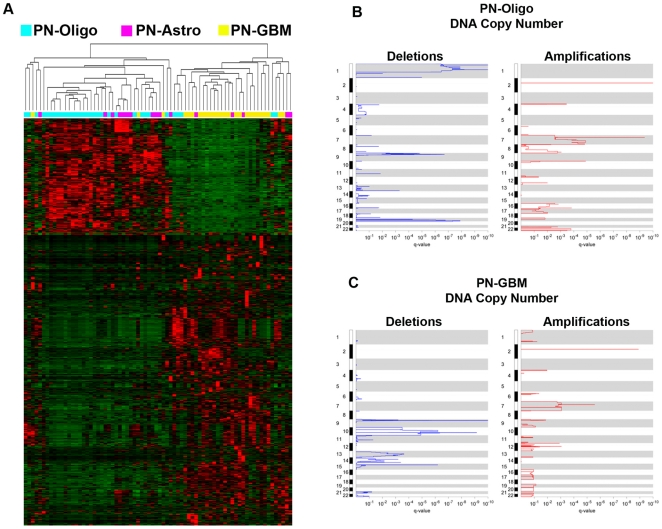
Figure 2. RNA and DNA copy number analysis of low- and high-grade proneural gliomas.
(A) Supervised hierarchical clustering of Proneural GBM, Proneural Oligodendrogliomas, and Proneural Astrocytomas using 847 probes significantly different between these subtypes based on differential marker analysis (FDR <5%, 1.8 Fold change). (B) Amplification and Deletion GISTIC Analysis of Proneural GBM and Proneural Oligodendrogliomas. Affymetrix SNP 6.0 data from the Rembrandt dataset was analyzed for copy number gain and loss using the GISTIC algorithm in GenePattern 3.0. A total of 26 Proneural GBM and 32 Proneural Oligodendroglioma samples were included in the analysis. No significant copy number changes were identified in the set of 14 Proneural Astrocytomas.

