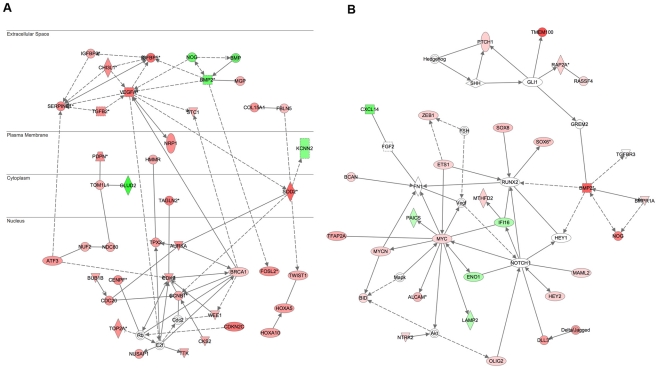
Figure 3. Network analysis of genes differentially expressed between low- and high-grade proneural gliomas identifies regulatory hubs.
(A) Protein interaction network generated by Ingenuity Pathway Analysis (IPA) of the 576 probes differentially expressed between Proneural GBM and Proneural Oligodendrogliomas/Astrocytomas. Proteins marked in red are increased in Proneural GBM samples, and those in green are decreased, relative to Proneural low grade gliomas. Solid lines represent direct interactions, and dashed lines represent indirect interactions. All interactions are derived on the Ingenuity Knowledgebase, which is extracted from the PubMed literature. (B) Protein interaction network based on IPA analysis of 129 genes differentially expressed between PN-Oligodendrogliomas and Classic and Neural Oligodendrogliomas. Network hubs are readily discernible around the Notch receptor, Myc oncogene, and the GLI1 transcription factor.

