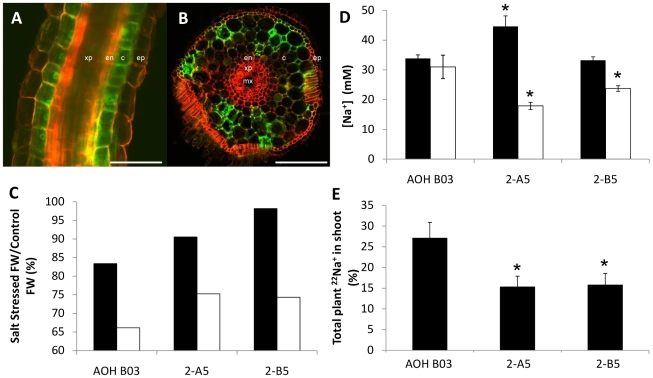
Figure 2. Rice plants expressing AtHKT1;1 within the root epidermal and cortical cells.
(A + B) Representative confocal laser microscope images of line AOH B03 showing GFP fluorescence specifically within the root epidermis and cortical cells [Scale bars = 100 µm in (A) and 100 µm in (B)]. Tissue was stained with propidium iodide. GFP and propidium iodide images were captured separately and overlaid to create the composite image. Tissues labelled include the epidermis (ep), cortex (c), endodermis (en), xylem parenchyma (xp) and metaxylem (mx). (C) Salinity stress tolerance in AOH B03 and two independently transformed T2 AOH B03 UASGAL4:AtHKT1;1 rice lines (2-A5 and 2-B5). Plants were stressed for 5 d at 80 mM. Bars represent: ((stress FW/control FW) ×100) in the roots (black bars) and shoots (open bars) (n = 8). (D) Concentration of Na+ within the roots (black bars) and shoots (open bars) of AOH B03 and AOH B03 UASGAL4:AtHKT1;1 lines (2-A5 and 2-B5) stressed for 5 d at 80 mM (n = 8, error bars represent SEM). Statistical significance from the AOH BO3 line for each tissue was determined using Student's t-test, *P<0.05. (E) Total amount of 22Na+ in the rice plant that is contained within the shoot tissue of the plant (expressed as a percentage) after exposing the roots of intact plants to a solution containing 30 mM Na+ for 1 h (n = 8, error bars represent SEM). Statistical significance from the AOH BO3 line was determined using Student's t-test, *P<0.05.

