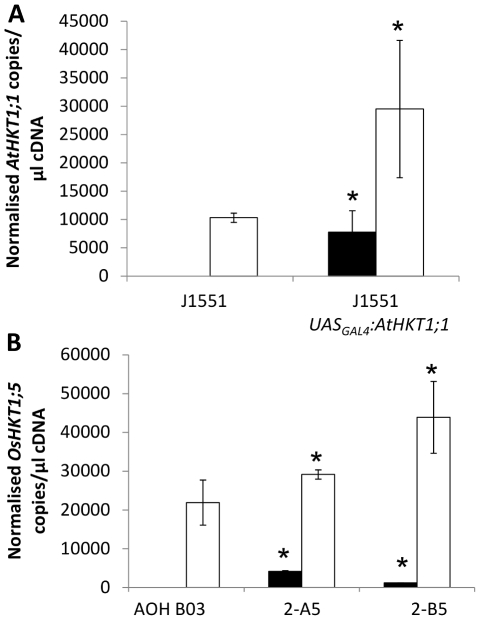
Figure 3. Root expression of HKT genes measured using quantitative reverse transcriptase PCR.
(A) Normalized measurements of the expression of the AtHKT1;1 transgene (black bars) and the endogenous AtHKT1;1 (open bars) in the roots of J1551 and T2 J1551 UASGAL4:AtHKT1;1 plants (n = 12, error bars represent SEM). Statistical significance from the J1551 line was determined for each gene using Student's t-test, *P<0.05. (B) Normalized measurements of the expression of the AtHKT1;1 transgene (black bars) and the OsHKT1;5 gene (open bars) within the roots of AOH B03 and two independently transformed T2 AOH B03 UASGAL4:AtHKT1;1 lines (2-A5 and 2-B5) (n = 4, error bars represent SEM). Statistical significance from the AOH BO3 line for each gene was determined using Student's t-test, *P<0.05.

