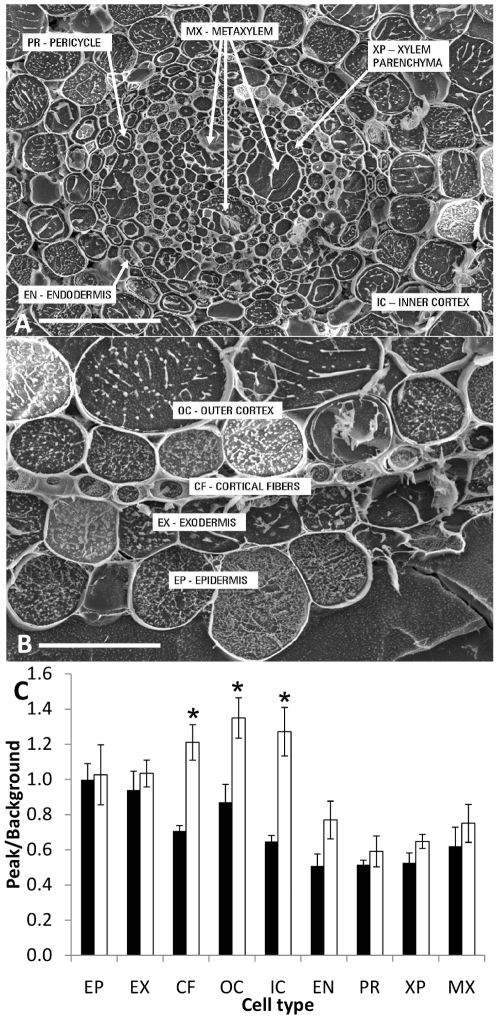
Figure 4. Scanning electron microscopy (SEM) images and measurements of amount of Na+ in specific root cell-types.
SEM images of the (A) stelar cell-types and (B) outer cell-types of the rice root [Scale bars = 100 µm in (A) and 20 µm in (B)]. (C) EDAX measurements of the amount of Na+ (software measurement of peak/background) present in 9 root cell-types of AOH B03 (black bars) and an AOH B03 UASGAL4:AtHKT1;1 line (2-B5) (open bars) including: EP - epidermis, EX - exodermis, CF – cortical fibres, OC – outer cortex, IC – inner cortex, EN - endodermis, PR - pericycle, XP – xylem parenchyma, MX - metaxylem. Each bar is an average of measurements made on three cells from each cell-type in the roots of three independent plants grown in a solution containing 50 mM Na+ for 5 d (error bars represent SEM). Statistical significance from the AOH BO3 line was determined using Student's t-test, *P<0.05.

