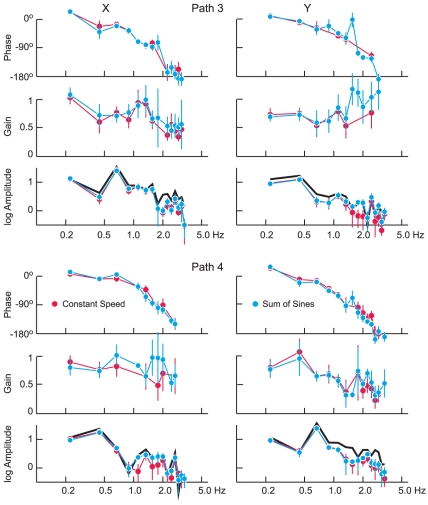
Figure 3. Frequency analysis of response to CS stimuli.
Results for horizontal motion (x) are shown on the left and for vertical motion (y) on the right. The top panels show results for path 3, the results for path 4 being shown below. The results are the mean ±1 SD for all 6 subjects, the traces in each panel depicting from top to bottom the phase and gain of eye velocity with respect to target velocity and the amplitude (on a logarithmic scale) of target velocity (black) and eye velocity. Results when the motion along the other axis followed a CS profile are shown in red and the corresponding results for the SS profile are shown in cyan. Note that the phase decreases consistently from a small lead at 0.22 Hz to a lag of about 180° at 3 Hz.

