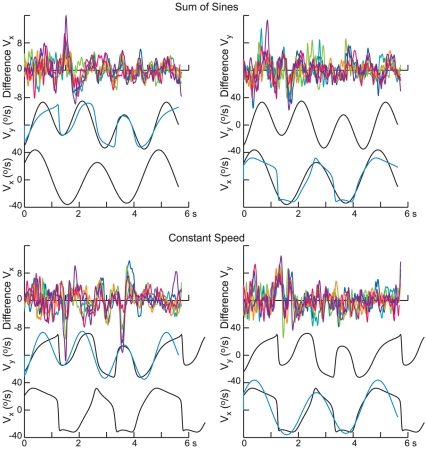
Figure 4. Degree of independence of pursuit motion along the horizontal and vertical directions.
Each panel shows the difference in horizontal pursuit velocity (left) and vertical pursuit velocity (right) for two of the stimulus conditions and path 5. Results for each of the subjects are shown superimposed in a different color. The stimulus conditions are shown below. For the panels on the left, horizontal target velocity was always generated by a sum of sines (top) or constant speed (bottom), for the two different vertical velocity profiles (shown in black and cyan). Note the difference in scale for the difference velocity and the target velocity traces.

