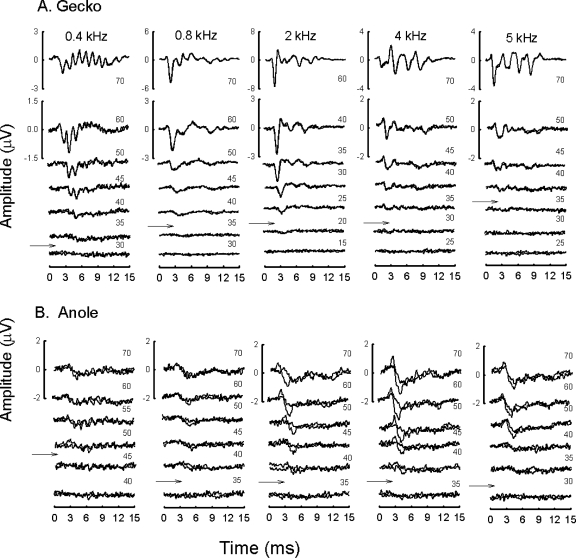
Figure 3.
Representative ABR waveforms for a single gecko and anole, evoked by tones of 0.4, 0.8, 2, 4 and 5 kHz. Different scales for the highest stimulus intensities are shown to the left of each averaged waveform. Arrows indicate estimated threshold. (A) Response waveforms for 0.4 kHz at 70 dB reveal well-defined frequency following response that masked later response peaks. Note that the use of alternating phases during data acquisition produces an averaged FFR of about 2F. (B) Response waveforms in the anole were smaller than those measured in the larger gecko. Note the large and sensitive response to increasing stimulus frequency.

