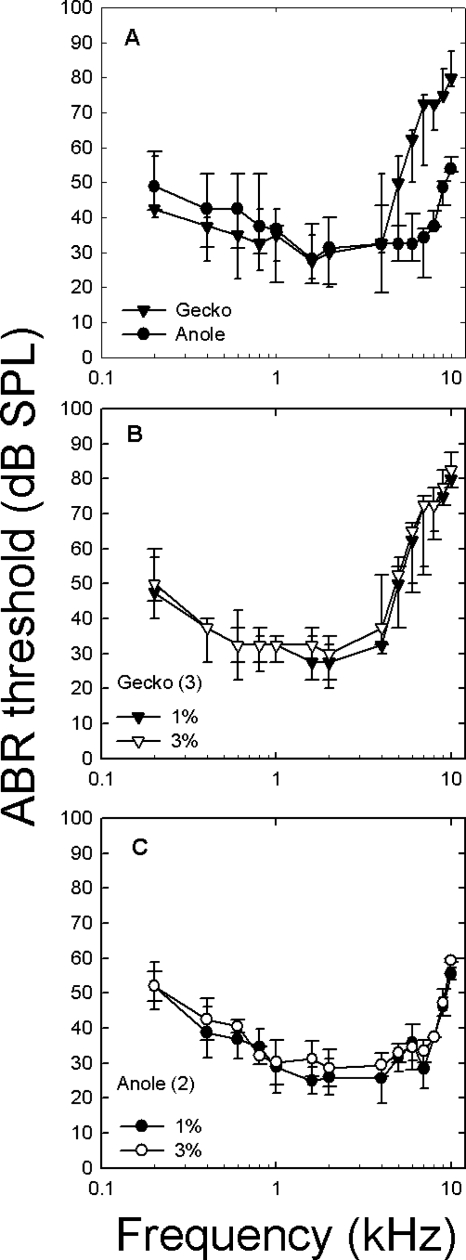
Figure 4.
ABR audiograms for geckos and anoles and for two anesthetic levels. Median thresholds (and ranges) are shown for all data. (A) ABR-derived audiograms for anoles (circles) and geckos (triangles). Note the similar thresholds, except above 4 kHz, where anole audiograms were consistently more sensitive. (B) ABR audiograms for 3 geckos measured at 1% and 3% isoflurane. (C) ABR audiograms for 2 anoles measured at 1% and 3% isoflurane.

