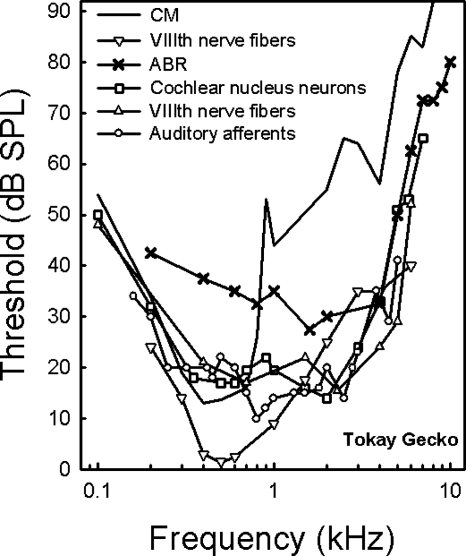
Figure 6.
Data showing the median gecko ABR audiogram (black X’s) in relation to cochlear microphonic data (CM gray solid line; Werner and Wever, 1972, Fig. 6), lowest thresholds of cochlear nucleus cells (black open square: Manley, 1972, Fig. 2), and VIIIth nerve data [gray inverted triangle: Sams-Dodd and Capranica, 1996, Fig. 2A; black triangle: Eatock et al., 1981, Fig. 2] and lowest thresholds of auditory afferents [black open circle: Manley et al., 1999, Fig. 2A].

