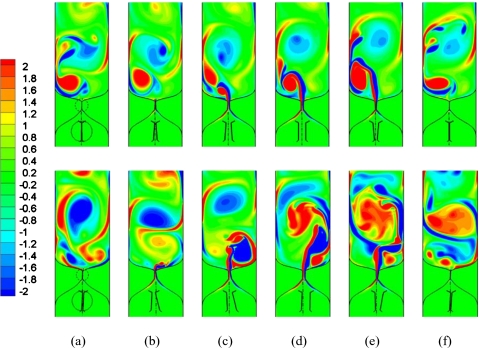
Figure 2.
A time sequence of spanwise vorticity contours in the asymmetric and symmetric models for one full vibration cycle. The first row represents the symmetric model and the second row corresponds to the asymmetric model with α=0.4. In both of the cases, Ps=1.0 kPa. Zoom-in view in each figure shows the vocal fold configuration at each time-instance.

