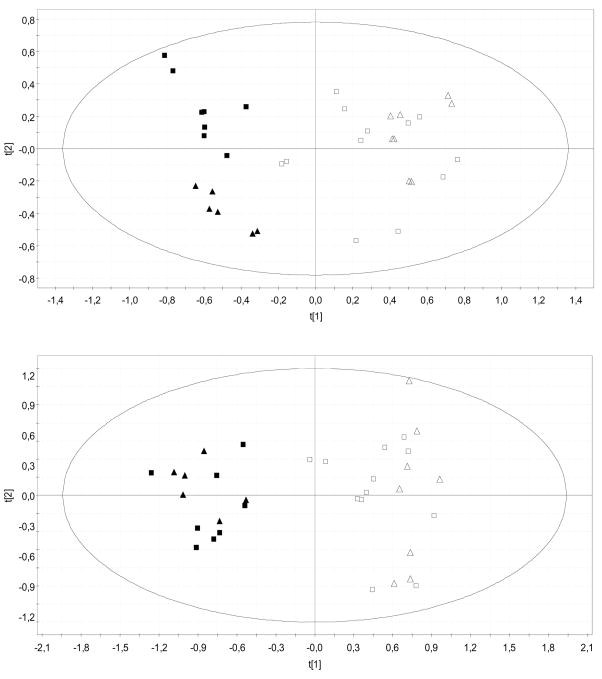
Figure 1.
PCA scores plots discriminating GNMT-KO mice from their WT littermates [Upper plot was obtained from negative ion UPLC™-MS data (t[1]: R2X = 0.28, Q2 = 0.20; t[2]: R2X = 0.09, Q2 = 0.03), lower plot from positive ion data (t[1]: R2X = 0.23, Q2 = 0.12; t[2]: R2X = 0.10, Q2 = 0.007) ]: 4 month old WT (n = 6), open squares; 6.5 month old WT (n = 4), open triangles; 4 month old GNMT-KO (n = 4), squares; 6.5 month old GNMT-KO (n = 3), triangles. Duplicate sample injection data are shown in the plots.

