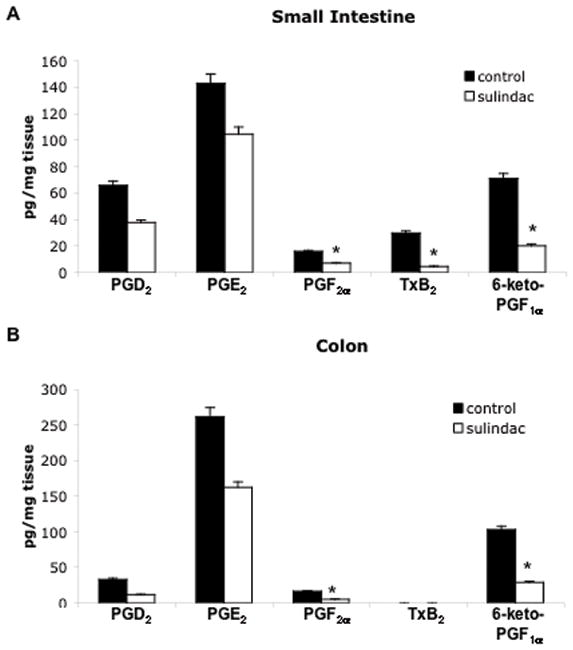
Figure 2. Sulindac reduces prostaglandin generation to similar extents in the small intestine and colon in ApcMin/+ mice.

PGD2, PGE2, PGF2α, thromboxane B2 (TxB2), and 6-keto-PGF1αlevels were determined in the small intestine (A) and colon (B) of sulindac treated and untreated 14-week-old ApcMin/+ mice by gas chromatography-mass spectrometry as described in Materials and Methods. Concentrations are expressed as picograms of PG per milligram of tissue. Columns, mean of 6 samples (control) or 8 samples (sulindac treated); bars, SE. *, P < 0.05, compared with ApcMin/+ control mice (Student’s t-test).
