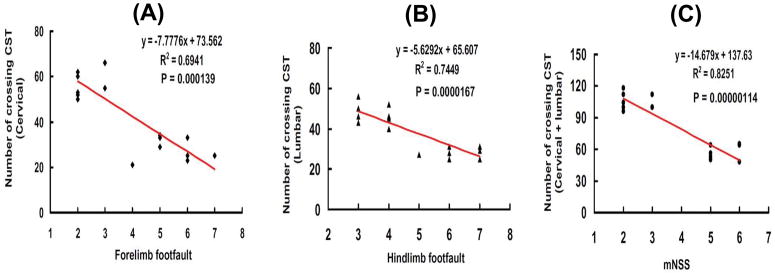
FIG. 3. Correlation of functional recovery with the number of midline axon crossings.
A. The line graph shows that the number of midline axons crossing at cervical level of the spinal cord is significantly and inversely correlated with the incidence of forelimb footfaults measured at Day 35 in rats after TBI and EPO treatment (P < 0.001). B: The line graph shows that the number of midline axons crossing at the lumbar level of the spinal cord is significantly and inversely correlated with the incidence of hindlimb footfaults measured at Day 35 in rats after TBI and EPO treatment (P < 0.001). C: The line graph shows that the total number of midline axon crossings at both cervical and lumbar levels of the spinal cord is significantly and inversely correlated with the mNSS score examined at Day 35 in rats after TBI and EPO treatment (P < 0.001). Data represent mean ± SD. N = 8 (Sham); 8 (Saline); 8 (EPO).

