
FIGURE 1.
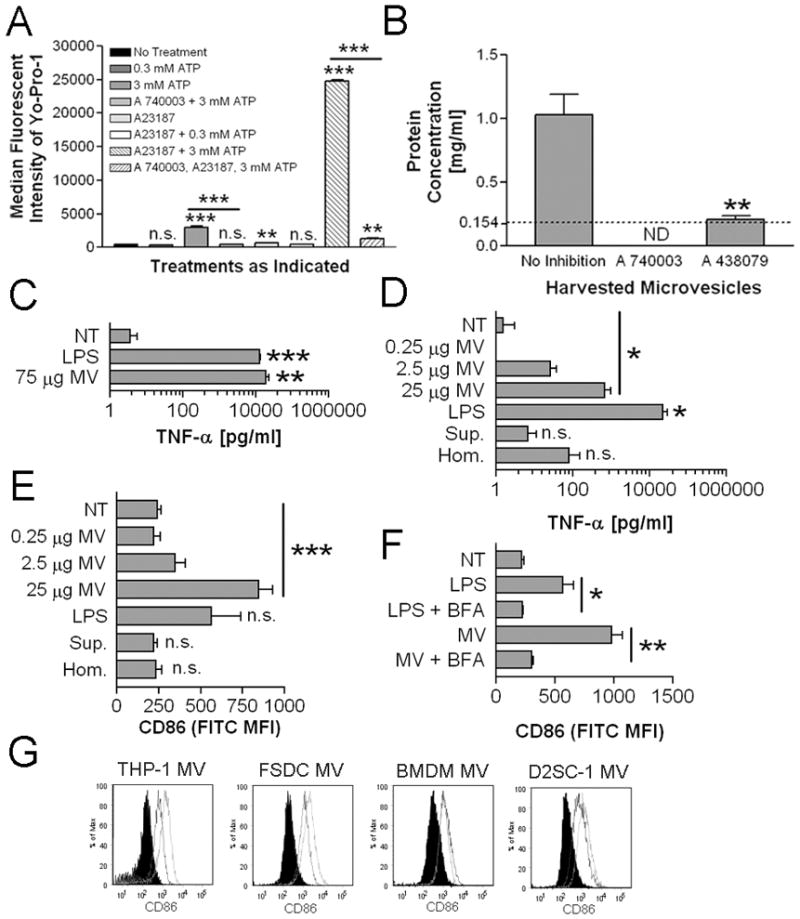
P2X7-induced MV elicit TNF-α secretion and upregulate CD86. A, J774A.1 were treated with or without 100 μM A 740003 then given further indicated treatment for 30 minutes. Cells were analyzed for Yo-Pro-1 association by flow cytometry. The histogram indicates median fluorescent intensities means ± SEM of n=3. Statistical comparisons are made to non-treated J774A.1 except where indicated with the inclusion bars. B, J774A.1 were treated with or without 100 μM A 740003 or 10 μM A 438079 for 15 minutes prior to MV generation. Harvested MV were quantified for their protein concentration by Bradford Assay. The histogram indicates protein concentration means ± SEM of n=3. Statistical comparisons are made to MV harvested from non-drug treated J774A.1. ND (not detectable) indicates that the protein concentration was lower than the lower limit of detection, which is marked with the dotted line. C, BMDM were treated with 1 μg/ml LPS, 75 μg protein equivalents of MV, or were left non-treated for 18 hours. The histogram indicates TNF-α means ± SEM of n=3. The statistical comparison is made to non-treated BMDM. D, BMDM were treated with 0.25, 2.5, or 25 μg protein equivalents of MV, 25 μg protein equivalents of cell homogenate (Hom.), the volume equivalent of 25 μg protein equivalent from ultracentrifugate following generation of MV pellets (Sup.), 1 μg/ml LPS, or were left non-treated for 18 hours. The histogram indicates TNF-α means ± SEM of n=3. The statistical comparison is made to non-treated BMDM. E, BMDM from D were analyzed for surface CD86 MFI means ± SEM of n=3. The statistical comparison is made to non-treated BMDM. F, BMDM were treated with 1 μg/ml LPS, 25 μg protein equivalents of MV, or were left non-treated with or without 10 μg/ml brefeldin A (BFA) for 18 hours. The histogram indicates surface CD86 MFI means ± SEM of n=3. G, MV harvested from PMA differentiated THP-1, FSDC, BMDM, or D2SC-1 (25μg protein equivalents) were incubated with 1 × 10⁶ BMDM for 18 hours. CD86 expression induced by MV from each indicated cell (solid line) is compared to CD86 expression induced by an equivalent amount of J774A.1 MV (dotted line) and to non-treated BMDM (black filled). Each flow cytometry histogram is representative of n=2.