
FIGURE 5.
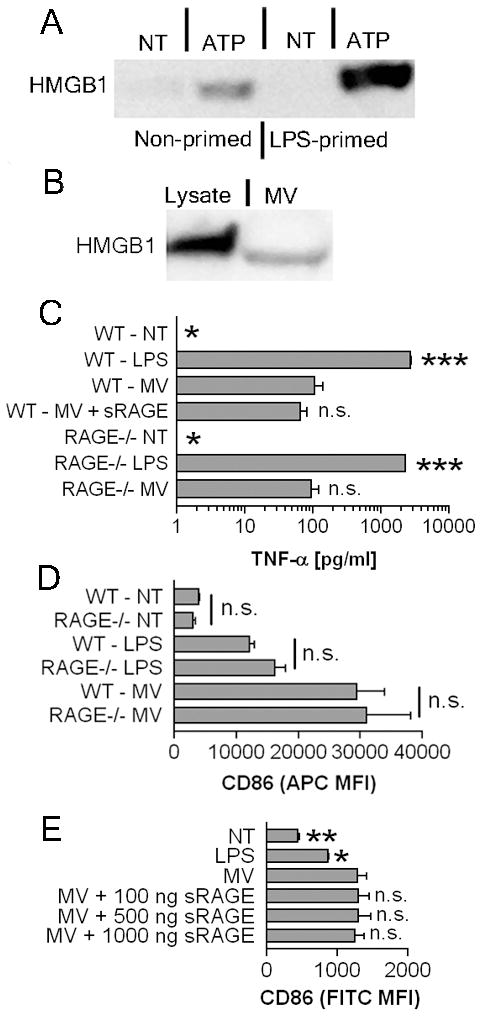
MV contain HMGB1 but CD86 upregulation is HMGB1 independent. A, J774A.1 cells were primed with 1 μg/ml LPS or left unprimed for 4 hours, then were treated with 3 mM ATP and 10 μM A23187 for 30 minutes or left untreated. Supernatants were collected, concentrated, and analyzed for HMGB1 by Western blot. Data shown is representative of repeat experiments. B, 25 μg protein equivalents from a reference lysate or 25 μg protein equivalents of MV were compared for HMGB1 expression via Western blot. C, 5 × 10⁵ WT or RAGE−/−BMDM were treated with 1 μg/ml LPS, 75 μg protein equivalents of MV with or without 30 minute pre-incubation with 1 μg/ml of soluble RAGE, or were left non-treated for 18 hours. The histogram indicates TNF-α means ± SEM of n=3. Statistical comparison is made to WT BMDM treated with 25 μg MV. D, WT or RAGE−/− BMDM were treated with 1 μg/ml LPS, 25 μg protein equivalents of MV, or were left untreated for 18 hours. The histogram indicates surface CD86 MFI means ± SEM of n=3. E, 25 μg protein equivalents of MV were pretreated with 100 ng/ml, 500 ng/ml, or 1,000 ng/ml of soluble RAGE for 30 minutes prior to addition to BMDM. No treatment, LPS, and 25 μg protein equivalents of MV were included as controls. Surface CD86 MFI and ± SEM of n=3 are shown. The statistical comparison is made to 25 μg MV alone treated BMDM.