Figure 1.
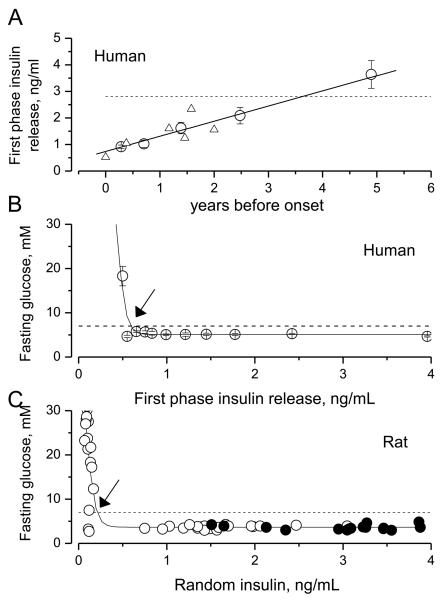
Decline in first phase insulin release (FPIR) before the onset of human type 1 diabetes (A) and relationships between FPIR (humans; B), random insulin (rat; C) and fasting glucose (FG).
(A) FPIR starts to decline long time before the onset of human type 1 disease (zero of X-axis). Circles represent FPIR data from patients who progressed to overt diabetes during an average of 3.6 years of the follow-up studies of first-degree relatives of subjects with T1DM (ranked and averaged data from Table 2 in [4]). The dashed line is a 10th percentile (2.8 ng/ml) of FPIR of normal non-obese individuals with no family history of diabetes from the study above. Triangles are results from similar studies in humans [5-8]. The solid line is the linear regression model fit to the data shown by circles.
(B) In humans, fasting glucose crosses the threshold for diabetes (7 mM, dashed line) within 6 months prior to onset of diabetes, when FPIR declines to about 0.5 ng/ml (arrow). Circles represent re-arranged and re-calculated data from Table 2 in [4]. Solid line is drawn by eye.
(C) In rats with STZ-induced pancreatic injury (open circles), fasting glucose exceeds the threshold for diabetes (7 mM, dashed line and arrow) in only those animals in which random plasma insulin was decreased below 10% of average insulin level of control rats (~3.5 ng/ml, filled circles). Data are from the current study. Each symbol represents individual animal. Solid curve is drawn by eye.

