Figure 2.
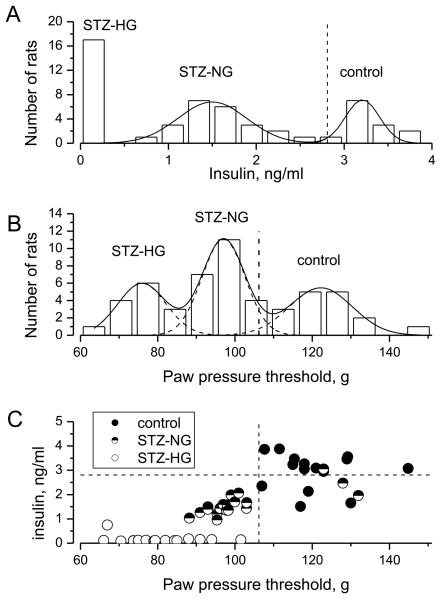
Frequency distributions of random blood plasma insulin (A), PPT (B) and relationship between PPT and insulin values measured in control and STZ-injected rats (total 53 animals).
(A) Frequency distribution of insulin values measured in the pooled population of STZ and control rats and fit with two Gaussian distributions model (solid curves). Data on insulin levels in STZ-HG, diabetic rats (left-most column) were not included during the fit procedure. The vertical dashed line denotes 2.3rd percentile for the right-most distribution, which was used as a cut-off value to define abnormal, reduced insulin production.
(B) Frequency distribution of PPT values measured in pooled population of STZ and control rats and fit with the sum of three Gaussian curves (solid and dashed curves). The vertical dashed line represents the 2.3rd percentile for the right-most distribution, which was used as a cut-off value to separate rats with a decreased tolerance in the paw-pressure test from those with normal tolerance.
(C) PPT and insulin values measured in control, STZ-NG and STZ-HG rats (closed, half-filled and opened circles, respectively; each symbol represents an individual animal). Horizontal and vertical dashed lines indicate respectively insulin and PPT cut-off values, defined as above.

