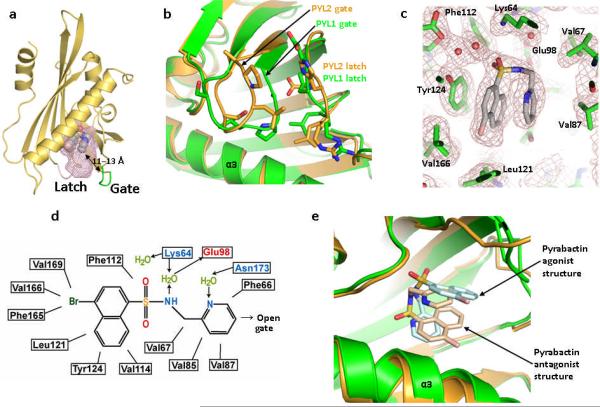
Figure 3.
PYL2–pyrabactin antagonist structure. (a) Overview of the PYL2–pyrabactin structure with the pocket shown as mesh. The gate and latch are shown in green and magenta with the gate-pyrabactin distance indicated. (b) Overlay of the gate and latch regions of the PYL2 antagonist (brown) and PYL1 agonist (green) structures. (c) 2 F0−Fc electron density map of bound pyrabactin and its surrounding residues contoured at 1.0 σ. (d) Schematic representation of the interactions between pyrabactin and PYL2 binding pocket residues. Charged interactions and hydrogen bonds are indicated by arrows, hydrophobic interactions by solid lines with hydrogen bond donors in blue and acceptors in red. The position of pyrabactin relative to the open gate is indicated. (e) Overlay of pyrabactin in the PYL2 antagonist (brown/ pale brown) and PYL1 agonist (green/ pale cyan) structures.

