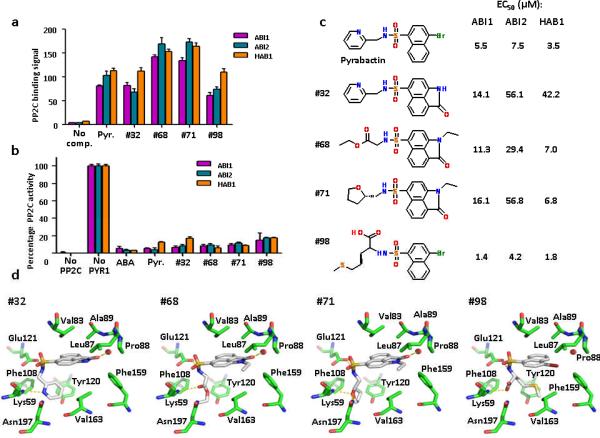
Figure 6.
Identification of pyrabactin-based ABA-receptor agonists. (a+b) Novel ABA agonists induce PYR1–PP2C interaction as determined by AlphaScreen assays (a) and induce PYR1-mediated PP2C inhibition as determined by phosphatase assay (b); Pyr=pyrabactin, (+)-ABA was used at 10 μM, all other compounds at 100 μM (n=3, error bars=s.d.). (c) 2D-structures of pyrabactin and pyrabactin-based ABA-receptor agonists. Listed next to each structure are the EC50 values for the stimulation of the PYR1 interaction with ABI1, ABI2, and HAB1 as determined by the binding curves shown in Supplementary Fig. 8. The EC50 values for pyrabactin are the average values from all binding curves in Supplementary Fig. 8. (d) Docking models for ABA agonists in the PYR1 ligand binding pocket. Hydrogen bonds are shown as dotted yellow lines, a water molecule between Leu87 and Pro88 as red sphere.

