
Figure 3.
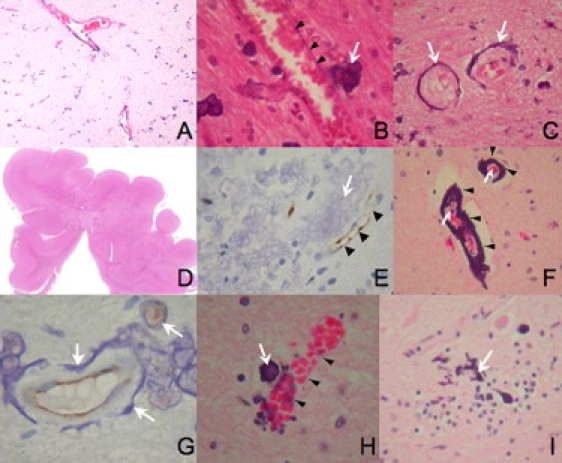
Sections from the Cerebral Cortex of Patient F312a1 with BLC-PMG
(A–C) H&E-stained sections. Low-power section (A) showing linear bands of calcification surrounding blood vessels and at higher power (B) showing calcification adjacent to (arrow), but not within, vessel walls (arrowheads). Rim (C) of calcification (arrows) surrounding two blood vessels in cross-section.
(D) Low-power view of section showing fused gyri indicative of PMG.
(E) CD31 stained section showing endothelium (arrowheads) staining adjacent to large region of calcification (arrow).
(F–I) H&E- (F, H, I) and CD31- (G) stained sections of cerebellum from F312a1.
(F) Calcification (arrowheads) surrounding two vessels of different sizes (arrows).
(G) Apparently intact endothelium (brown) within a ring of calcification (arrows).
(H) Calcification in a cell (arrow) in close apposition to a normal blood vessel (arrowheads).
(I) “Stag-horn” appearance suggesting calcification in a Purkinje cell (arrow).