
Figure 6.
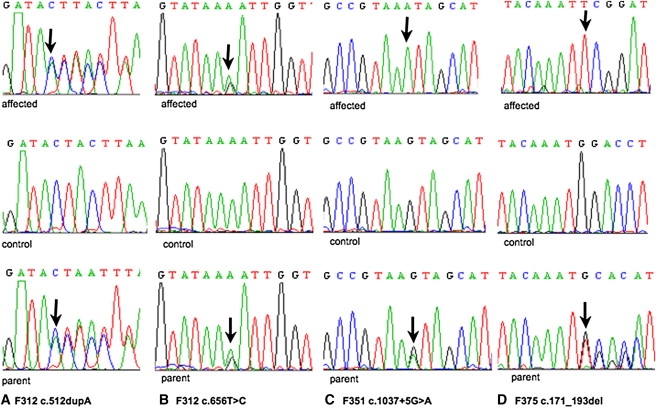
Demonstration of Four OCLN Variants
Top: Sequence chromatograms of affected individuals. Middle: Sequence chromatograms of control sample with wild-type allele. Bottom: Sequence chromatograms of parent with heterozygous mutation. Mutations are highlighted (arrow).
(A) Chromatogram of c.512 dupA in F312.
(B) Chromatogram of c.656T>C in F312.
(C) Chromatogram of splice site variant in F351.
(D) Chromatogram of 22 base pair deletion in F375.