Abstract
Background
Multifocal visual evoked potentials (mfVEP) provide topographic measure of visual response amplitude and latency.
Objective
To evaluate the sensitivity and specificity of mfVEP technique in detecting visual abnormalities in multiple sclerosis (MS) patients.
Methods
mfVEPs were recorded from 74 MS patients with history of optic neuritis (MS-ON, n=74 eyes) or without (MS-no-ON, n=71 eyes), and 50 normal subjects (controls, n=100 eyes) using a 60-sector pattern reversal dartboard stimuli (VERIS). Amplitude and latency for each sector were compared to normative data and assigned probabilities. Size and location of clusters of adjacent abnormal sectors (p < 5%) were examined.
Results
Mean response amplitudes were 0.39±0.02SE, 0.53±0.02, and 0.60±0.01 for MS-ON, MS-no-ON and control groups, respectively, with significant differences between all groups (p<0.0001). Mean latencies (ms; relative to normative data) were 12.7±1.3SE (MS-ON), 4.3±1.1 (MS-no-ON), and 0.3±0.4 (controls); group differences again significant (p<0.0001). Half the MS-ON eyes had clusters larger than 5 sectors compared to 13% in MS-no-ON and 2% in controls. Abnormal sectors were diffusely distributed, although the largest cluster was smaller than 15 sectors in two thirds of MS-ON eyes. Cluster criteria combining amplitude and latency showed an area of 0.96 under the receiver operating characteristic curve yielding a criterion with 91% sensitivity and 95% specificity.
Conclusions
The mfVEP provides high sensitivity and specificity in detecting abnormalities in visual function in MS patients.
Keywords: multiple sclerosis, optic neuritis, electrophysiology, multifocal visual evoked potentials, visual evoked potentials, subclinical, visual pathways
Introduction
Multiple sclerosis (MS) is an inflammatory demyelinating disease of the central nervous system. Demyelinating optic neuritis (ON) occurs in more than 50% of MS patients at some point during the disease course and it is the initial manifestation of MS in 38% of patients [1]. After an acute attack of ON, visual acuity and light sensitivity, as measured in automated visual field testing, typically recover to near normal levels despite residual visual complaints from these patients [2]. The visual evoked potential (VEP), on the other hand, has been found to reveal optic nerve conduction delays in patients with recovered acuities and fields, and even in some MS patients without a history of clinical signs or symptoms of ON [3-8]. The ability of the VEP to detect subclinical demyelination could be important for the diagnosis of MS and subsequent monitoring of treatment and disease progression. However, the traditional VEP (tVEP) measures responses summed over a large area of the visual field (typically at least 15 deg in diameter). Therefore responses are a mixture with contributions from both abnormal and normal regions of the visual field, and are dominated by regions producing the largest responses [6,9]. Local defects can be missed. Responses may even cancel due to regional variations in waveform.
To measure more local VEP responses, recent research has focused on the development of the multifocal VEP (mfVEP) approach, initially developed by Sutter and colleagues [10,11]. Using the mfVEP, a single recording session can generate many (typically 60) local VEP responses simultaneously from a 22 deg radius of the visual field. The clinical utility of the mfVEP has been greatly enhanced by recent refinements in the technique including the use of cortically-scaled stimuli, multi-channel recordings, monocular and interocular analyses, signal-to-noise amplitude measurements, as well as strategies for automating measurements of latency, and probability plots (analogous to the total deviation plots in the Humphrey visual field test) [12-14]. Several recent studies have demonstrated the sensitivity of the mfVEP technique in identifying defects following recovery from an episode of ON [15-18]. Compared to previous mfVEP studies of ON, the current study involved a larger population of MS patients, and analyzed eyes from patients both with, and without a history of ON. From the perspective of clinical diagnosis and management of MS, it is probably more important to provide evidence of subclinical lesions than to document clear ON events [19].
The primary purpose of this study was to evaluate the sensitivity and specificity of the mfVEP in detecting abnormalities in the visual pathway in MS patients. We recorded monocular mfVEPs for each eye of 74 MS patients, in whom about half of the eyes had a clear history of ON (MS-ON eyes), half did not (MS-no-ON eyes). We compared records from eyes of MS patients to records from 100 eyes of 50 normal control subjects in our lab, and we have compared results from all subjects to norms from 100 subjects in a previously developed analysis package from another lab using similar recording techniques [20-22]. A criterion for defining an abnormal mfVEP was determined using receiver operating characteristic (ROC) curves. The topography of abnormal sectors across the visual field was reported for MS eyes with or without a history of ON. We found that the mfVEP provides high sensitivity and specificity in detecting abnormalities in visual function in MS patients. A report on some of the results in this study appeared previously in abstract form (Cheng et al., Invest. Ophthalmol. Vis. Sci. 2007: E-Abstract 3765).
Methods
Subjects
Seventy four clinical definite MS patients, all at relapsing remitting stage (RRMS: age: 21-60 yrs with a mean of 40 ± 9.6 yrs; M:F = 1:3.5) and 50 healthy subjects (age: 21-58 yrs with a mean of 31 ± 11, M:F = 1:1.1) participated in the study. Informed consent was given by all participants. All procedures adhered to the tenets of Declaration of Helsinki, and the protocol was approved by the University of Houston Committee for the Protection of Human Subjects.
MS patients
An experienced ophthalmologist (R. Tang or J. Schiffman) performed a comprehensive eye exam on all MS patients and identified the eyes with ON based on clinical signs and symptoms [23,24]. Time from MS diagnosis ranged from patients who were just diagnosed to those diagnosed as long as 35 years before in one case (mean ± SD: 6.3 ± 6.5 years). Patients had no known ocular or systemic diseases, other than ON/MS, that could affect the visual system. A total of 145 MS eyes were included, and divided into “MS-ON” (n = 74) and “MS-no-ON” (n = 71) groups based on a positive or negative history of ON. Three eyes were excluded: two due to unclear history regarding ON, and another due to a total loss of vision. The visual acuity (VA) in the MS-ON group ranged from 20/15 to 20/100, with a median of 20/20. Seven eyes in the MS-ON group had VA between 20/40 – 20/100. All eyes in the MS-no-ON group had VA 20/20 or better except one that had VA of 20/40. In the MS-ON group, the average number of ON attacks was 1.4 ± 0.6 SD. Twenty-three eyes had experienced more than one attack of ON and five of them had more than three ON events. The time elapsed from the last ON attack was 4.4 ± 6.3 SD years on average. In addition, 19 MS patients (38 eyes) had bilateral ON and 16 MS patients (32 eyes) had no ON in either eye. In the remaining 39 MS patients, 36 eyes had unilateral ON, 39 eyes had no-ON, and 3 eyes were excluded (see above).
Normal Subjects
All normal subjects underwent a comprehensive eye examination prior to the study, and had no ocular diseases or systemic conditions that could affect the visual system. All eyes (n = 100) had best corrected visual acuity 20/25 or better and were included as a “Control” group.
MfVEP procedures and analysis
Stimulus (VERIS 5.1, mfVEP paradigm)
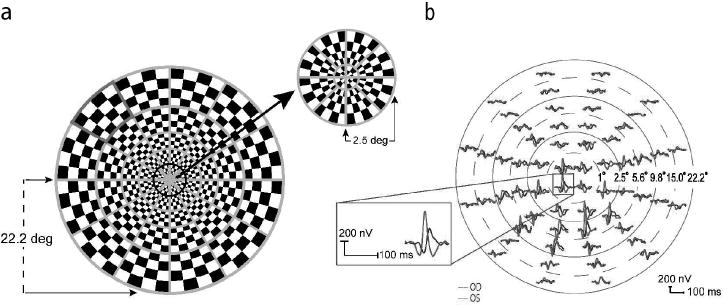
A 60 sector cortically scaled dartboard pattern was presented on a 20” CRT monitor with a frame rate of 75 Hz (Figure 1a). Each sector had 16 checks (8 black and 8 white), and followed a pseudorandom sequence of contrast reversal (m-sequence with 215-1 steps) [25]. Photopic luminance (cd/m2) of the stimulus was calibrated using a spot photometer (model LS-100, Minolta Camera Co., Ltd., Japan). Mean luminance of the pattern was 66 cd/m2 and the Michelson contrast was calculated to be 95%. The display was positioned 35.5 cm from the subject, covering a 44 degree diameter of the visual field. Subjects viewed through their natural pupils with appropriate refractive corrections in place, and were instructed to maintain fixation at the stimulus center (marked as an “x”). During recording, the eye position was monitored constantly by the examiner via the camera display provided in the VERIS hardware.
Figure 1.
(a) The mfVEP dartboard stimulus with one of the sectors marked in red. (b) MfVEP responses from the two eyes of an MS patient with a history of ON in the right eye. The dashed and solid circles illustrate six concentric rings of increasing retinal eccentricity from 1° for the most central ring (ring 1), to 22.2° for the most peripheral ring (ring 6). The position of each of the 60 waveforms has been adjusted to enable better visualization. The inset shows the responses from one location on an expanded scale.
Electrode placement and recordings
Three channels were recorded simultaneously and 3 additional channels were derived mathematically using the customized software as described by Hood and colleagues [13,26]. The first channel electrode was placed 4 cm above the inion, second and third channel electrodes 1 cm above and 4 cm to the left and right of the inion, the reference electrode at the inion, and the ground electrode on the forehead. Two 7-minute recordings from each eye were averaged for offline analysis [13,21,22].
Data Analysis
After exporting the first slice of the second-order kernel responses from the VERIS 5.1 system (Electro-diagnostic Imaging, San Mateo, CA), all data analyses were performed with the customized software based on the ‘best channel’ responses described by Dr. Hood and his colleagues [13,21,22]. In brief, the software calculates monocular and interocular response amplitudes and latencies for each sector as the following. The monocular amplitude (MAMP) defined as the signal to noise ratio (SNR) was calculated as the root mean square (RMS) of the sector’s waveform in the signal window (45-150 ms) divided by the mean RMS from the noise windows (325-430 ms) of all 60 sectors [13]. The interocular amplitude (IAMP) was ratio of the RMS of the signal window in the right eye to that in the left eye [13]. The monocular latency (MLAT) was calculated using cross correlation between the waveform and a template derived from the Portland 100 normal controls (Devers Eye Institute, Portland, OR) [21], and is the shift in milliseconds (ms) needed to achieve the best cross correlation determined by the ‘xcorr’ function in MATLAB (The MathWorks Inc. Natick, MA). Thus, the monocular latency derived based on this template method is a ‘relative latency’ measure. The interocular latency (ILAT) was also calculated using ‘xcorr’ and represents the shift in milliseconds to achieve the best cross correlation between a subject’s responses from the two eyes.
Probability Plots
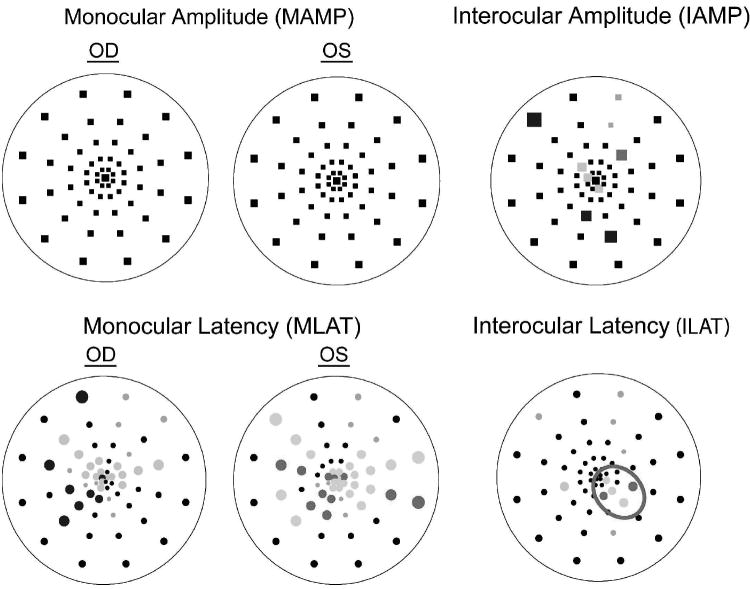
For each eye, the software also constructs 4 probability plots (MAMP, IAMP, MLAT and ILAT), each analogous to the total deviation plot of the Humphrey visual field, by comparing a sector’s amplitude and latency with the Portland normative database [13,21,22]. Specifically, the amplitude or latency at each location was compared to the mean and standard deviation of the normative data at the corresponding location, and assigned a probability value. The resultant plot (Figure 2) is a topographical map comprised of 60 points representing the 60 mfVEP sectors, each marked as ‘normal’ (p>0.05) or ‘abnormal’ (p<0.05 or p<0.01). A black point indicates responses within normal limits. Colored points denote abnormal responses (desaturated colors for p<0.05, and saturated colors for p<0.01). The color refers to whether the left (red) or right (blue) eye mfVEP was abnormal in a given sector. The gray symbols indicate sectors with invalid measurements. Specifically, for IAMP, sectors with SNRs < 0.23 log unit in both eyes were invalid for inter-ocular comparison whereas for latency calculations (MLAT or ILAT), responses with SNR < 0.23 log unit or with cross-correlation values < 0 were invalid and excluded from analysis [13,22]. For each probability plot, the percent of abnormal points was calculated as the number of colored points divided by the total number of measurable points [13,22]. In Figure 2, there were 9% abnormal points in the ILAT plot corresponding to the 5 points colored in red divided by a total of 54 valid (measurable) points.
Figure 2.
Probability plots for an MS patient. Black squares (amplitude plots: MAMP and IAMP) and circles (latency plots: MLAT and ILAT) indicate no significant differences compared to the “Portland” normative database (monocular plots), or between the two eyes (interocular plots). Colored symbols indicate significantly smaller amplitude or longer latency in OD (blue) or OS (red), p<0.01 (saturated) or p<0.05 (desaturated). Gray symbols denote responses that were too small for comparisons to be made (using criteria described in Hood and Greenstein [13]; Hood et al. [20]). Outlined in red is a cluster of adjacent points with p<0.05.
Each probability plot was examined for the presence of clusters of adjacent abnormal (i.e., colored) points and the clusters were represented by the p values of each included sector. For example, the cluster outlined in red (Figure 2) was denoted as 15551 where ‘1’ and ‘5’ represented abnormal sectors with p < 0.01 and p < 0.05, respectively. The cluster size was defined as the number of abnormal sectors in the cluster, and the depth as a probability level of ‘5’ or ‘1’. A cluster criterion was used to determine whether a probability plot was abnormal. A probability plot with a cluster equal to (size and depth) or more severe than the criterion was considered to meet the criterion (i.e., to be abnormal). For example, a cluster criterion of 15 would classify probability plots with cluster of minimally 15 but also with 11, 155, 115, 111, etc as abnormal. Cluster criteria as defined above were used in the construction of ROC curves to distinguish normal from abnormal mfVEPs. When describing the size of clusters (Fig. 4) or the spatial distribution of abnormal sectors (Fig. 5) in MS eyes, all sectors with probability p < 0.05 were counted.
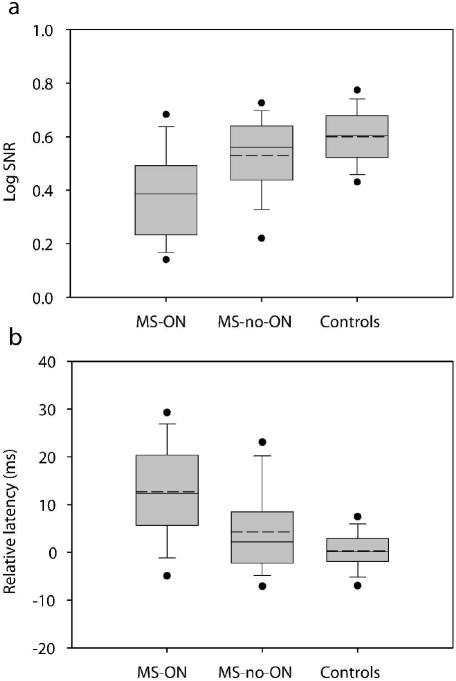
Figure 4.
Summary of overall (60 sector mean) log SNR (a) and relative latency (b) for the MS-ON, MS-no-ON, and Controls groups. In each box the solid and dashed horizontal lines represent the median and mean respectively. The lower and upper boundaries of each box are the 25th and 75th percentiles, the whiskers (error bars) indicate the 10th and 90th percentiles, and the filled circles indicate the 5th and 95th percentiles.
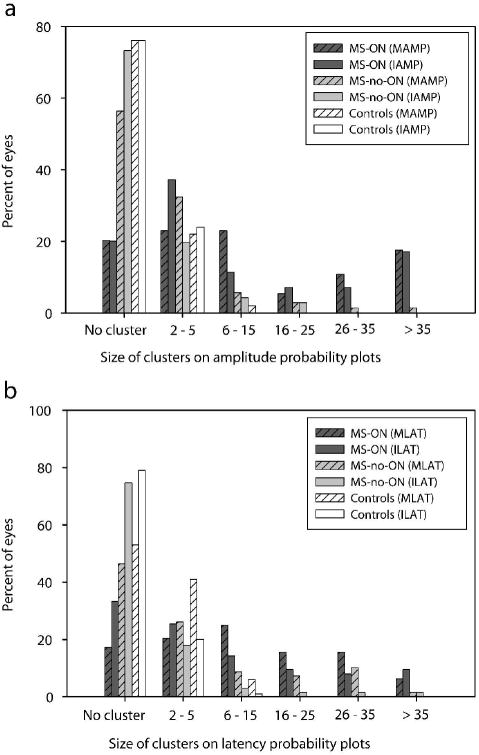
Figure 5.
Distribution of the largest cluster size from each eye for monocular amplitude (MAMP) or interocular amplitude (IAMP) probability plots (a), and monocular latency (MLAT) or interocular latency (ILAT) plots (b) for the MS patients and control subjects.
Statistical analysis
To represent the mean response amplitude from an eye, the mean of the log SNR from all measurable points in that eye was calculated. Log SNR was used here instead of SNR because previous studies [13,20,22] and our current data showed that the distribution of the SNR on a logarithmic scale closely followed a normal distribution (see Fig. 22 in Hood and Greenstein, 2003). ANOVA and Tukey post-hoc analysis (Minitab, Inc. State College, PA) were performed to test the statistical differences between measurements from the MS-ON, MS-no-ON and the control groups. Student’s t-test was used to compare the mean log SNR and latencies in two subgroups of MS-no-ON eyes (Discussion). ROC curves were constructed for the 74 eyes of MS patients with a clear history of ON (MS-ON group) to assess true positive rates, and for the 100 eyes of our own lab controls (Control group) to assess false positive rates.
Results
Effect of recovery time since the last episode of ON on the mfVEP amplitude and latency
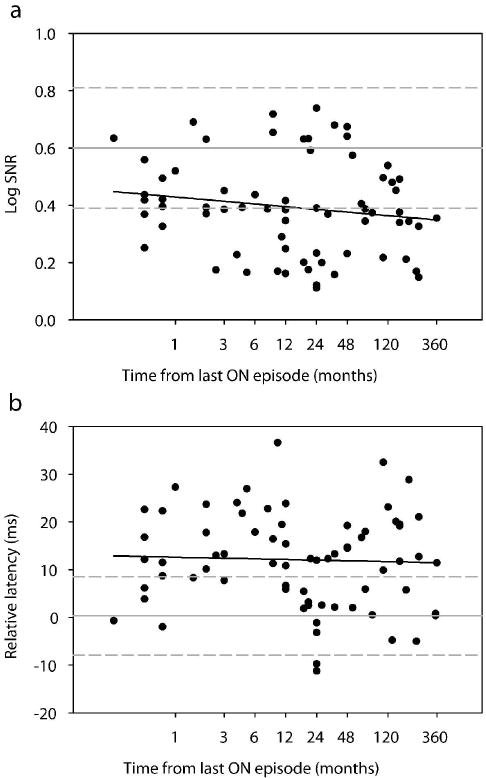
The MS-ON group in our study included 74 eyes whose time from the last ON event ranged from less than 1 month to 35 years. Previous longitudinal studies have shown both short-term and long-term recovery of VEP amplitude and latency in ON eyes after an acute episode [4,18,27-31]. To examine the effect of recovery time on mfVEPs in our cross-sectional data sample, we plotted the mean monocular amplitude (log SNR) (Fig. 3a) and mean monocular latency (please note that the latency is a ‘relative latency’ measure as described in Methods) (Fig. 3b) of individual eyes as a function of the recovery time from the last ON attack. Regression analysis on either linear or logarithmic scale did not indicate a significant change of response amplitude (linear: slope = -0.0004, p = 0.19; log: slope = -0.01, p = 0.20) or latency (linear: slope = 0.0086, p = 0.78; log: slope = -0.19, p = 0.76) over time. For the ten eyes whose recovery time was less than 1 month, although the episode was recent, vision was minimally impaired. All eyes had visual acuity better than 20/25. Only two eyes had mean deviation (MD) of the Humphrey visual field (24-2) worse than -3 dB (-3.83 dB and -9.04 dB). The mfVEP in all ten eyes was recordable with log SNR ranging between 0.25 and 0.63 (mean 0.43). Since in our sample the mfVEP amplitude and latency did not change significantly over time, we have reported all eyes with history of ON as one group, the MS-ON, except for specific additional analyses related to recovery time (see Table 1).
Figure 3.
Log SNR (a) and relative latency (b) versus time from last episode of ON for all eyes with a history of optic neuritis (n = 74 eyes). In (b), the signs of the relative latency indicate whether an eye’s response lags (+) or lead (-) the template. The abscissa was plotted on a logarithmic scale for a better visualization of the performance of eyes within the first year after an ON event. The gray horizontal solid and dashed lines represent the mean ±2 standard deviations from our control subjects. Linear regression analysis of the data using the logarithmic X axes shown in the plots yielded: A. slope = -0.01 and p = 0.20 B. slope = -0.19 and p = 0.76. Findings were similar when regression analysis was performed using linear X axes.
Table 1.
Abnormality in the visual pathway found for different MS groups
| Amplitude | Latency | Amplitude or Latency | |
|---|---|---|---|
| MS-ON (n=74 eyes) | 74% | 73% | 91% |
| ON < 6 mo (n=21 eyes) | 86% | 80% | 90% |
| ON > 6 mo (n=53 eyes) | 70% | 70% | 91% |
| MS-no-ON (n=71 eyes) | 17% | 25% | 31% |
| Controls (n=100 eyes) | 3% | 2% | 5% |
MfVEP amplitude and latency for control, MS-ON, and MS-no-ON groups
Fig. 4 shows the range, mean and median of the monocular response amplitude (log SNR) and latency for the normal control, the MS-ON, and the MS-no-ON eyes. Based on the Anderson-Darling normality test, the distribution of log SNR (p = 0.405) or latency (p = 0.917) in our control group was not statistically different from normal. The range and mean of the log SNR (Fig. 4a) and latency (Fig. 4b) of our control group are in good agreement with those from the Portland normal controls that were recorded and analyzed in similar ways as this study (Devers Eye Institute, Portland, OR) [20,21]. The mean log SNR for MS-ON eyes was 0.39 (± 0.02 SE). It was significantly reduced compared to 0.53 (± 0.02 SE) in MS-no-ON eyes, and the mean log SNR for both MS-ON and MS-no-ON groups was significantly reduced compared to 0.6 (± 0.01 SE) in our control group (p < 0.0001, ANOVA, Tukey post-hoc). The mean latency of MS-ON eyes was 12.7 ms (± 1.3 SE), significantly longer than 4.3 ms (± 1.1 SE) in MS-no-ON eyes, and the mean latency in both MS-ON and MS-no-ON groups was significantly longer than 0.3 ms (± 0.4 SE) in our normal control eyes (p < 0.0001, ANOVA, Tukey post-hoc).
Characteristics of probability plots
The topographic information of the mfVEP amplitude and latency is best described by probability plots. These plots are analogous to the Humphrey visual field (HVF) total deviation plots. Previous studies of HVF and mfVEP have shown that defining a defect in terms of a cluster of contiguous abnormal points reduces the false positive rate [12,13,22,32-34]. Fig. 5 shows the different sizes of clusters observed on each probability plot for eyes from individual study groups. For an eye with more than one cluster, only the largest cluster was shown in this plot (see Discussion). Adding across the percent of eyes in the plots, about half the MS-ON-eyes (57%, 43%, 63% and 41% on MAMP, IAMP, MLAT and ILAT plots, respectively) had clusters larger than 5 compared to an average of 13% in MS-no-ON eyes and 2% in normal eyes. Linear regression analysis did not show an effect of time from last ON episode on the size of clusters (slope = 0.004, p = 0.75).
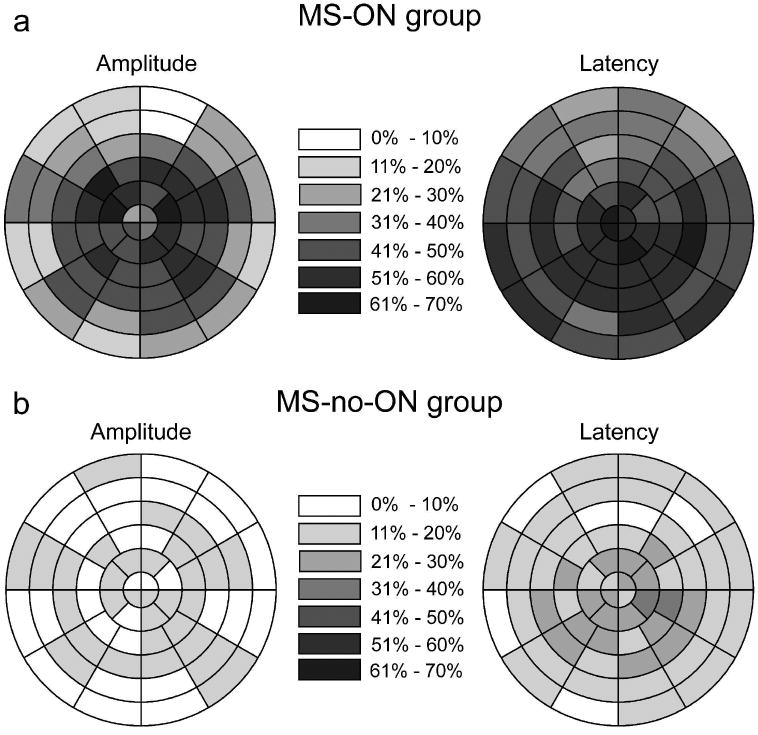
To illustrate the spatial distribution (the location) of abnormal sectors for MS eyes across the visual field, the percent of eyes that had abnormal amplitude (Fig. 6, left plots) or latency (Fig. 6, right plots) was plotted for each sector. A sector from an eye was considered to be abnormal in amplitude when that sector reached p < 0.05 on either MAMP or IAMP plot. Data from the left eyes were reflected along the vertical meridian and treated as right eyes. Abnormal latency for a sector was determined the same way. Overall, as the figure shows, all field locations (central or periphery) were affected, and there was a tendency for the central 10 degree field (rings 1-4) to be more affected than the periphery (rings 5-6) on the amplitude plot of MS-ON eyes (Fig. 6a, left). Abnormal latency was more diffusely distributed than abnormal amplitude.
Figure 6.
Spatial distribution of abnormal points in MS-ON eyes (a) and MS-no-ON eyes (b). A sector from an eye was considered to be abnormal when that sector reached p < .05 on either the monocular or the interocular probability plot. Data from the left eyes were reflected along the vertical meridian and treated as right eyes. For each sector, the gray scale indicates the percentage of eyes with abnormal amplitude (left) or latency (right).
ROC curves and cluster criteria
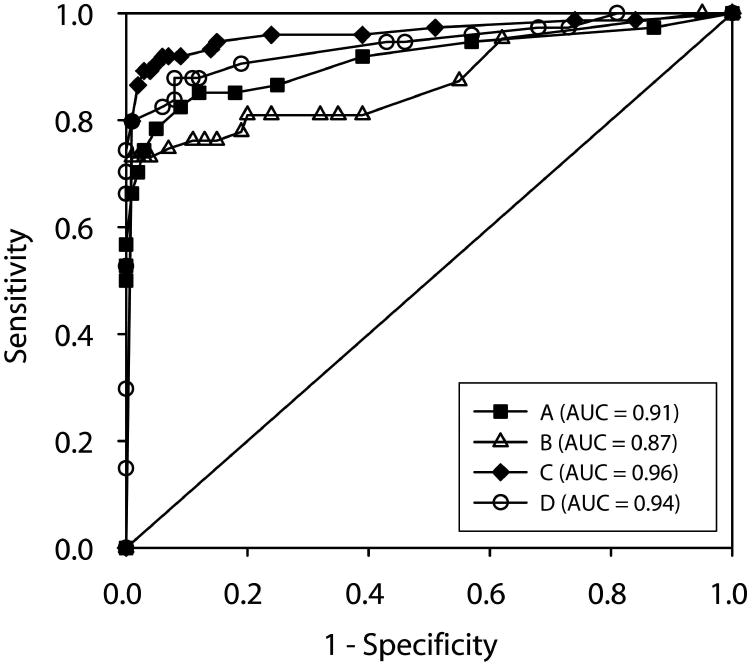
ROC curves (Fig. 7) were constructed by plotting the percent of MS-ON eyes (n = 74) classified as abnormal (true positive rate or “sensitivity”) against the percent of our normal control eyes (n = 100) classified as abnormal (false positive rate or “1-specificity”). Four different sets of criteria were used to define an eye as abnormal based on the probability plots: A) cluster criterion for amplitude, B) cluster criterion for latency, C) combined cluster criterion for amplitude and latency, and D) percent of abnormal points. For the criteria A-C, the ROC curve was constructed by varying the cluster size and depth from 5 to 11111. For example, a cluster criterion of 15 indicates that all probability plots that had a cluster of 15 or worse such as 15, 11, 155, 115, 111, etc. were considered abnormal. For criterion A or B, an eye was defined as having abnormal amplitude when MAMP or IAMP probability plot met the criterion and abnormal latency when MLAT or ILAT met the criterion. For criterion C, an eye was abnormal if any of the 4 plots (MAMP, IAMP, MLAT or ILAT) met a criterion, and the criterion for amplitude plots can be different from the criterion for latency plots. For ‘% of abnormal points’ criterion, the ROC curve was constructed by varying the percent of abnormal points from 5% to 90% and an eye was considered to be abnormal if one of the 4 probability plots met the criterion.
Figure 7.
ROC curves were constructed by plotting the percent of MS-ON eyes (n = 74) classified as being abnormal (true positive rate or “sensitivity”) against the percent of our own control eyes (n = 100) classified as abnormal (false positive rate or “1-specificity”). The four curves are (A) cluster criterion for amplitude – filled squares (area under the curve (AUC) = 0.91), (B) cluster criterion for latency – open triangles (AUC =0.87), (C) combined cluster criterion – filled diamonds (AUC = 0.96), and (D) percent of abnormal points – open circles (AUC = 0.94).
The area under the ROC curves (AUC, Fig. 7, legend) ranged from 0.87 to 0.96 with the criterion C (combined cluster criterion) performing the best (0.96). As expected, criterion C performed better than A and B because some eyes had either abnormal amplitude or latency but not both.
Based on the ROC curve C, the cluster criterion that yielded the highest specificity (95%) and sensitivity (91%) for our data was 55555 for MAMP and IAMP plots, and 1111 or a cluster size >7 for MLAT and ILAT plots. In other words, 91% of MS-ON eyes were detected as being abnormal using the cluster criteria defined above. The percent of eyes found to be abnormal was similar (Table 1, last column) when the MS-ON group was further divided based on the time elapsed from the last ON event to 6 months or more (MS-ON > 6 mo), or less than 6 months (MS-ON < 6 mo). In addition, 31% of MS-no-ON group was found to be abnormal (Table 1).
Discussion
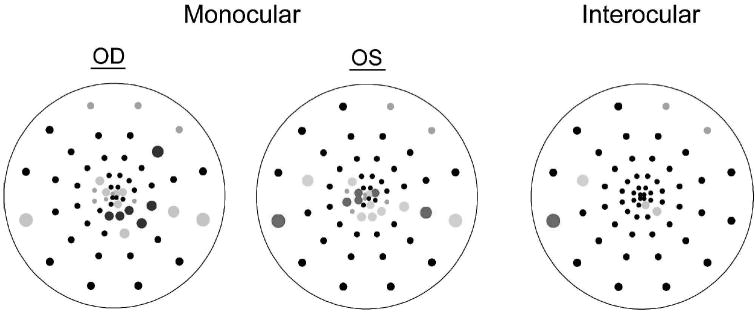
This study evaluated mfVEP characteristics in a group of 74 MS patients having eyes with or without a history of ON, and also compared the mfVEP of our own normal control group to the existing Portland norms used in the data analysis software as described by Hood and his colleagues. Our mfVEPs were recorded under similar conditions to those of the Portland normal controls except for a use of a slightly lower mean luminance (66 cd/m2 vs 100 cd/m2 in Fortune et al. which is about 0.2 log units), because of differences in monitor characteristics. The response amplitude (measured as log SNR) and latency in our control group had ranges and means similar to the Portland norms [20,21]. The prevalence of abnormal clusters (adjacent sectors with p < 0.05) of various sizes in our normal control group was similar to the Portland norms on all probability plots except that in our MLAT plots we had more eyes with relatively large clusters [21]. Specifically, five of our normal controls had cluster sizes of 7 (4 eyes) or larger (one eye with a cluster size of 9 and another with 14) on the MLAT plots. Interestingly, the contralateral eye in each individual also had relatively large clusters at similar field locations (see an example in Fig. 8), and none of these subjects had a large cluster on the ILAT plots (all clusters on ILAT were of 2 or less). The homologous ‘abnormality’ seen in the MLAT plots of these subjects is likely due to different visual cortex folding and/or position in relation to the electrode placement in these subjects. The lower mean luminance used in our study compared to that used for the Portland’s normative database was unlikely to be a contributing factor. In control experiments in five normal subjects we recorded the mfVEP when the mean luminance was reduced even more with neutral density (ND) filters, and clusters of abnormal sectors did not emerge until the ND filter was at least 0.6 log units. This observation is also supported by previous studies using tVEP [35,36]. Similarities and differences in control groups such as documented here show the need for each lab, even though using similar approaches, to establish a local normal control database.
Figure 8.
Monocular and interocular latency probability plots from a control subject. Black circles indicate no significant differences compared to a normative database (monocular plots), or between the two eyes (interocular plot). Colored symbols indicate significantly longer latency in OD (blue) or OS (red) with p<0.01 (saturated) or p<0.05 (desaturated). Gray symbols denote responses that were determined to be too small to measure latency (using criteria described in Hood et al. [20]; Hood et al. [21]).
In this study, the mfVEP (based on combined amplitude and latency findings) detected 91% (67/74 eyes) of the ON eyes using a set of cluster criterion with 95% specificity. Several previous studies reported the sensitivity and specificity of the mfVEP in MS/ON. Fraser et al. [15] reported the mfVEP sensitivity and specificity of 100% in detecting amplitude and latency abnormalities in 27 eyes of MS-ON patients. The same lab, in a separate study, reported a sensitivity of 89% in 26 unilateral ON eyes [37]. Grover et al. (2008) reported that for a specificity of 90%, the sensitivity of cluster analysis for the mfVEP latency plots (MLAT or ILAT) was 94.7% (18/19 eyes), and Pakrou et al. [17] identified 96% (24/25) of ON eyes as abnormal. Direct comparison of sensitivity/specificity among different groups is difficult due to different study populations and the criteria used to define abnormality. Several reasons may contribute to the less than ideal (100%) sensitivity in our study. First, there was a relatively large number of bilateral ON in our MS-ON group (51% of eyes). In cases of bilateral ON, the interocular probability plots become less sensitive in detecting defects in either eye. In fact four out of the seven eyes missed by all established criteria in this study were those patients with bilateral ON. Additionally, the time elapsed from the last ON event to the mfVEP recording was 6 years on average, and should have lead to recovery in some eyes [4,18,27-31]. Although we did not see a clear trend of change in the mean log SNR and latency in our study population (Fig. 3), we did observe some recovery in amplitude and latency when cluster criteria were used. Compared to the eyes recorded within 6 months of the last ON event (ON < 6mo), fewer eyes recorded after 6 months (ON > 6 mo) were found to have abnormal amplitude or latency (Table 1, columns 2 and 3). The percent of eyes that were abnormal either in amplitude or latency (Table 1, column 4) was similar in the ON < 6 mo and ON > 6 mo subgroups because more eyes in the ON < 6 mo subgroup were abnormal in both amplitude and latency. Future longitudinal study will allow us to directly evaluate recovery after an episode of ON. Another possibility is that we used the same cluster criterion for the MLAT and ILAT plots although only MLAT plots required a relatively stringent cluster criterion (Discussion above). However, using less stringent cluster criteria for the ILAT plots did not change the sensitivity of detecting abnormality in the visual pathway in MS-ON eyes.
A unique benefit of the VEP is its ability to expose a subclinical lesion in the clinically unaffected eye [6]. In this study, 31% of eyes without ON history were identified as abnormal agreeing with previous reports of subclinical lesions [4,38]. In particular, 25% of our MS-no-ON eyes showed abnormal latencies indicating the presence of demyelination. To examine whether such abnormality is associated with an ON history in the contralateral eye, we divided the MS-no-ON eyes into those with a history of ON in the fellow eyes (39 eyes) and those without (32 eyes). Mean log SNR (p = 0.72, t-test) and latency (p = 0.16, t-test) were not significantly different between the two subgroups.
Use of the mfVEP provided a unique opportunity to examine the spatial extent (the size) of functional defects of ON/MS lesions. Although many (23 of 74 eyes) of our MS-ON eyes had more than one ON attack, the largest cluster size in any probability plot was smaller than 15 in about two thirds of the MS-ON eyes and over 90% of the MS-no-ON eyes. Only 21% of all probability plots from the MS-ON eyes had more than one cluster, and the second largest cluster size was in the range of 2 to 10 sectors with only 30% larger than 3 sectors. Our results indicate that a large proportion of abnormal regions (either in amplitude or latency) observed was moderate in size, which suggests that the mfVEP may be a sensitive tool for monitoring clinical or subclinical MS lesions. However, more studies are needed to evaluate the test-retest repeatability of the mfVEP cluster sizes/locations in diseased eyes, and the short and long term variability of the mfVEP in the normal population [39,40].
As noted in the Introduction, the mfVEP has theoretical advantages over the tVEP in detecting MS/ON defects. Two aspects of our data support the advantage of mfVEP. First, as discussed in the last paragraph, in many eyes, the size of the abnormality was moderate or small (less than 15 sectors). Second, the location of the affected areas was not limited to the central field. As the tVEP is dominated by the central 10 degree of the field [6], defects in the periphery are likely to be missed by the tVEP. Based on our Fig. 6, an average of 26% of the MS-ON eyes showed abnormal amplitude (Fig. 6a), and 41% showed abnormal latency (Fig. 6b) in sectors located in the two outmost rings (i.e., between 10 to 22 degrees of eccentricity). These peripheral abnormalities could be missed by the tVEP if the central field was not involved as well. Klistorner et al. [37] directly compared the mfVEP and tVEP in 26 unilateral ON eyes, and found that sensitivity was improved from 73% (tVEP) to 89% (mfVEP). They stated that the gain was mostly from the mfVEP detecting more amplitude abnormality and stated that the misses by tVEP “mainly occurred when the affected areas was well localized and situated away from the center of the visual field”. In a separate study by Grover et al. [41], the latency performance of the mfVEP and tVEP was compared in 19 ON eyes and only 2 additional eyes were detected by the mfVEP. However, it is important to note that the abnormality in the Grover’s study was relatively wide spread as a median of 51% of the locations were significantly delayed on the interocular latency plot. Also, in Klistorner’s study, the time elapsed from ON diagnosis to the mfVEP/tVEP recording was on average 5.5 months, much shorter than the current study (6 years). It is possible that the advantage of the mfVEP over the tVEP is more demonstrable for mild abnormalities. As of now, the mfVEP test is significantly more time consuming than the tVEP. Improvements in the mfVEP technique that are being developed and reported, such as use of a sparse stimulus paradigm [42,43] will shorten the mfVEP recording time and make it more readily applicable in the clinic. Finally, the topographic information provided by the mfVEP can be used to compare, location by location with other topographic measurements, e.g. HVF or optical coherence tomography (OCT). HVF and OCT findings on some subjects in this study were published previously [44], and a manuscript describing direct comparisons among the mfVEP, HVF and OCT tests for most of the same subjects is currently being prepared.
Conclusions
The mfVEP technique provides high sensitivity and specificity in detecting visual pathway abnormalities in MS/ON patients, and is useful in detecting subclinical lesions. The moderate spatial extent of the abnormality found in many MS/ON patients and the involvement of areas outside the central 10 deg of the visual field support the benefit that mfVEP provides for revealing local or mild defects, and its potential utility for monitoring recovery or progression of the disease over time.
Acknowledgments
This study was supported by NIH grants P30 EY07751, T35 007088, a pilot grant from the National Multiple Sclerosis Society, a University of Houston GEAR grant, and the Minnie Flaura Turner memorial fund for impaired vision research.
We wish to thank Dr. Don Hood for his generosity with the software for analysis of mfVEP data, and Dr. Ying Sheng Hu for helpful discussions on statistical analyses.
References
- 1.Beck RW, Trobe JD, Moke PS, Gal RL, Xing D, Bhatti MT, et al. High- and low-risk profiles for the development of multiple sclerosis within 10 years after optic neuritis: experience of the optic neuritis treatment trial. Arch Ophthalmol. 2003;121:944–949. doi: 10.1001/archopht.121.7.944 121/7/944 [pii]. [DOI] [PubMed] [Google Scholar]
- 2.Cleary PA, Beck RW, Bourque LB, Backlund JC, Miskala PH. Visual symptoms after optic neuritis. Results from the Optic Neuritis Treatment Trial. J Neuroophthalmol. 1997;17:18–23. doi: 10.1016/s0002-9394(14)70814-1. quiz 24-18. [DOI] [PubMed] [Google Scholar]
- 3.Fishman GA, Birch DG, Holder GE, B MG, editors. Electrophysiologic Testing in Disorders of the Retina, Optic Nerve, and Visual Pathway. 2. Vol. 85. BMJ Publishing Group Ltd; San Francisco: [Google Scholar]
- 4.Frederiksen JL, Petrera J. Serial visual evoked potentials in 90 untreated patients with acute optic neuritis. Surv Ophthalmol. 1999;44(Suppl 1):S54–62. doi: 10.1016/s0039-6257(99)00095-8. [DOI] [PubMed] [Google Scholar]
- 5.Halliday AM, McDonald WI, Mushin J. Delayed visual evoked response in optic neuritis. Lancet. 1972;1:982–985. doi: 10.1016/s0140-6736(72)91155-5. [DOI] [PubMed] [Google Scholar]
- 6.Halliday AM, McDonald WI, Mushin J. Visual evoked response in diagnosis of multiple sclerosis. Br Med J. 1973;4:661–664. doi: 10.1136/bmj.4.5893.661. [DOI] [PMC free article] [PubMed] [Google Scholar]
- 7.Halliday AM, McDonald WI, Mushin J. Delayed pattern-evoked responses in optic neuritis in relation to visual acuity. Trans Ophthalmol Soc U K. 1973;93:315–324. [PubMed] [Google Scholar]
- 8.Heckenlively JR, Arden GB, editors. Principles and Practice of Clinical Electrophysiology of Vision. Mosby Year Book; St. Louis, MO: [Google Scholar]
- 9.Fortune B, Hood DC. Conventional pattern-reversal VEPs are not equivalent to summed multifocal VEPs. Invest Ophthalmol Vis Sci. 2003;44:1364–1375. doi: 10.1167/iovs.02-0441. [DOI] [PubMed] [Google Scholar]
- 10.Baseler HA, Sutter EE, Klein SA, Carney T. The topography of visual evoked response properties across the visual field. Electroencephalogr Clin Neurophysiol. 1994;90:65–81. doi: 10.1016/0013-4694(94)90114-7. [DOI] [PubMed] [Google Scholar]
- 11.Sutter EE. The fast m-transform: a fast computation of cross-correlations with binary m-sequences. SIAM J Comput. 1991;20:686–694. doi: 10.1137/0220043. [DOI] [Google Scholar]
- 12.Goldberg I, Graham SL, Klistorner AI. Multifocal objective perimetry in the detection of glaucomatous field loss. Am J Ophthalmol. 2002;133:29–39. doi: 10.1016/s0002-9394(01)01294-6. S0002939401012946 [pii] [DOI] [PubMed] [Google Scholar]
- 13.Hood DC, Greenstein VC. Multifocal VEP and ganglion cell damage: applications and limitations for the study of glaucoma. Prog Retin Eye Res. 2003;22:201–251. doi: 10.1016/s1350-9462(02)00061-7. S1350946202000617 [pii] [DOI] [PubMed] [Google Scholar]
- 14.Klistorner AI, Graham SL. Electroencephalogram-based scaling of multifocal visual evoked potentials: effect on intersubject amplitude variability. Invest Ophthalmol Vis Sci. 2001;42:2145–2152. [PubMed] [Google Scholar]
- 15.Fraser CL, Klistorner A, Graham SL, Garrick R, Billson FA, Grigg JR. Multifocal visual evoked potential analysis of inflammatory or demyelinating optic neuritis. Ophthalmology. 2006;113:323 e321–323 e322. doi: 10.1016/j.ophtha.2005.10.017. S0161-6420(05)01222-4 [pii] [DOI] [PubMed] [Google Scholar]
- 16.Klistorner A, Arvind H, Nguyen T, Garrick R, Paine M, Graham S, et al. Axonal loss and myelin in early ON loss in postacute optic neuritis. Ann Neurol. 2008;64:325–331. doi: 10.1002/ana.21474. [DOI] [PubMed] [Google Scholar]
- 17.Pakrou N, Casson R, Kaines A, Selva D. Multifocal objective perimetry compared with Humphrey full-threshold perimetry in patients with optic neuritis. Clin Experiment Ophthalmol. 2006;34:562–567. doi: 10.1111/j.1442-9071.2006.01277.x. CEO1277 [pii] [DOI] [PubMed] [Google Scholar]
- 18.Yang EB, Hood DC, Rodarte C, Zhang X, Odel JG, Behrens MM. Improvement in conduction velocity after optic neuritis measured with the multifocal VEP. Invest Ophthalmol Vis Sci. 2007;48:692–698. doi: 10.1167/iovs.06-0475. 48/2/692 [pii] [DOI] [PubMed] [Google Scholar]
- 19.Klistorner A, Arvind H, Nguyen T, Garrick R, Paine M, Graham S, et al. Fellow eye changes in optic neuritis correlate with the risk of multiple sclerosis. Mult Scler. 2009;15:928–932. doi: 10.1177/1352458509105228. 1352458509105228 [pii] [DOI] [PubMed] [Google Scholar]
- 20.Fortune B, Zhang X, Hood DC, Demirel S, Johnson CA. Normative ranges and specificity of the multifocal VEP. Doc Ophthalmol. 2004;109:87–100. doi: 10.1007/s10633-004-3300-5. [DOI] [PubMed] [Google Scholar]
- 21.Hood DC, Ohri N, Yang EB, Rodarte C, Zhang X, Fortune B, et al. Determining abnormal latencies of multifocal visual evoked potentials: a monocular analysis. Doc Ophthalmol. 2004;109:189–199. doi: 10.1007/s10633-004-5512-0. [DOI] [PubMed] [Google Scholar]
- 22.Hood DC, Zhang X, Rodarte C, Yang EB, Ohri N, Fortune B, et al. Determining abnormal interocular latencies of multifocal visual evoked potentials. Doc Ophthalmol. 2004;109:177–187. doi: 10.1007/s10633-004-5511-1. [DOI] [PubMed] [Google Scholar]
- The clinical profile of optic neuritis. Experience of the Optic Neuritis Treatment Trial. Optic Neuritis Study Group. Arch Ophthalmol. 1991;109:1673–1678. doi: 10.1001/archopht.1991.01080120057025. [DOI] [PubMed] [Google Scholar]
- 24.Hickman SJ, Dalton CM, Miller DH, Plant GT. Management of acute optic neuritis. Lancet. 2002;360:1953–1962. doi: 10.1016/s0140-6736(02)11919-2. S0140673602119192 [pii] [DOI] [PubMed] [Google Scholar]
- 25.Sutter EE. Imaging visual function with the multifocal m-sequence technique. Vision Res. 2001;41:1241–1255. doi: 10.1016/s0042-6989(01)00078-5. S0042-6989(01)00078-5 [pii] [DOI] [PubMed] [Google Scholar]
- 26.Hood DC, Zhang X, Hong JE, Chen CS. Quantifying the benefits of additional channels of multifocal VEP recording. Doc Ophthalmol. 2002;104:303–320. doi: 10.1023/a:1015235617673. [DOI] [PubMed] [Google Scholar]
- 27.Brusa A, Jones SJ, Kapoor R, Miller DH, Plant GT. Long-term recovery and fellow eye deterioration after optic neuritis, determined by serial visual evoked potentials. J Neurol. 1999;246:776–782. doi: 10.1007/s004150050454. 92460776.415 [pii] [DOI] [PubMed] [Google Scholar]
- 28.Brusa A, Jones SJ, Plant GT. Long-term remyelination after optic neuritis: A 2-year visual evoked potential and psychophysical serial study. Brain. 2001;124:468–479. doi: 10.1093/brain/124.3.468. [DOI] [PubMed] [Google Scholar]
- 29.Hickman SJ, Toosy AT, Miszkiel KA, Jones SJ, Altmann DR, MacManus DG, et al. Visual recovery following acute optic neuritis--a clinical, electrophysiological and magnetic resonance imaging study. J Neurol. 2004;251:996–1005. doi: 10.1007/s00415-004-0477-1. [DOI] [PubMed] [Google Scholar]
- 30.Hidajat RR, Goode DH. Normalisation of visual evoked potentials after optic neuritis. Doc Ophthalmol. 2003;106:305–309. doi: 10.1023/a:1022973100421. [DOI] [PubMed] [Google Scholar]
- 31.Klistorner A, Graham S, Fraser C, Garrick R, Nguyen T, Paine M, et al. Electrophysiological evidence for heterogeneity of lesions in optic neuritis. Invest Ophthalmol Vis Sci. 2007;48:4549–4556. doi: 10.1167/iovs.07-0381. 48/10/4549 [pii] [DOI] [PubMed] [Google Scholar]
- 32.Graham SL, Klistorner AI, Grigg JR, Billson FA. Objective VEP perimetry in glaucoma: asymmetry analysis to identify early deficits. J Glaucoma. 2000;9:10–19. doi: 10.1097/00061198-200002000-00004. [DOI] [PubMed] [Google Scholar]
- 33.Hood DC, Zhang X, Winn BJ. Detecting glaucomatous damage with multifocal visual evoked potentials: how can a monocular test work? J Glaucoma. 2003;12:3–15. doi: 10.1097/00061198-200302000-00002. [DOI] [PubMed] [Google Scholar]
- 34.Hood DC, Zhang X, Greenstein VC, Kangovi S, Odel JG, Liebmann JM, et al. An interocular comparison of the multifocal VEP: a possible technique for detecting local damage to the optic nerve. Invest Ophthalmol Vis Sci. 2000;41:1580–1587. [PubMed] [Google Scholar]
- 35.Heravian-Shandiz J, Douthwaite WA, Jenkins TC. Binocular interaction with neutral density filters as measured by the visual evoked response. Optom Vis Sci. 1991;68:801–806. doi: 10.1097/00006324-199110000-00009. [DOI] [PubMed] [Google Scholar]
- 36.Katsumi O, Tanino T, Hirose T. Objective evaluation of binocular function using the pattern reversal visual evoked response. II. Effect of mean luminosity. Acta Ophthalmol (Copenh) 1986;64:199–205. doi: 10.1111/j.1755-3768.1986.tb06900.x. [DOI] [PubMed] [Google Scholar]
- 37.Klistorner A, Fraser C, Garrick R, Graham S, Arvind H. Correlation between full-field and multifocal VEPs in optic neuritis. Doc Ophthalmol. 2008;116:19–27. doi: 10.1007/s10633-007-9072-y. [DOI] [PubMed] [Google Scholar]
- 38.Noval S, Contreras I, Rebolleda G, Munoz-Negrete FJ. Optical coherence tomography versus automated perimetry for follow-up of optic neuritis. Acta Ophthalmol Scand. 2006;84:790–794. doi: 10.1111/j.1600-0420.2006.00724.x. AOS724 [pii] [DOI] [PubMed] [Google Scholar]
- 39.Fortune B, Demirel S, Zhang X, Hood DC, Johnson CA. Repeatability of normal multifocal VEP: implications for detecting progression. J Glaucoma. 2006;15:131–141. doi: 10.1097/00061198-200604000-00010. 00061198-200604000-00010 [pii] [DOI] [PubMed] [Google Scholar]
- 40.Klistorner A, Graham SL. Intertest variability of mfVEP amplitude: reducing its effect on the interpretation of sequential tests. Doc Ophthalmol. 2005;111:159–167. doi: 10.1007/s10633-005-5363-3. [DOI] [PubMed] [Google Scholar]
- 41.Grover LK, Hood DC, Ghadiali Q, Grippo TM, Wenick AS, Greenstein VC, et al. A comparison of multifocal and conventional visual evoked potential techniques in patients with optic neuritis/multiple sclerosis. Doc Ophthalmol. 2008;117:121–128. doi: 10.1007/s10633-007-9112-7. [DOI] [PMC free article] [PubMed] [Google Scholar]
- 42.James AC, Ruseckaite R, Maddess T. Effect of temporal sparseness and dichoptic presentation on multifocal visual evoked potentials. Vis Neurosci. 2005;22:45–54. doi: 10.1017/S0952523805221053. S0952523805221053 [pii] [DOI] [PubMed] [Google Scholar]
- 43.Ruseckaite R, Maddess T, Danta G, Lueck CJ, James AC. Sparse multifocal stimuli for the detection of multiple sclerosis. Ann Neurol. 2005;57:904–913. doi: 10.1002/ana.20504. [DOI] [PubMed] [Google Scholar]
- 44.Cheng H, Laron M, Schiffman JS, Tang RA, Frishman LJ. The relationship between visual field and retinal nerve fiber layer measurements in patients with multiple sclerosis. Invest Ophthalmol Vis Sci. 2007;48:5798–5805. doi: 10.1167/iovs.07-0738. 48/12/5798 [pii] [DOI] [PMC free article] [PubMed] [Google Scholar]


