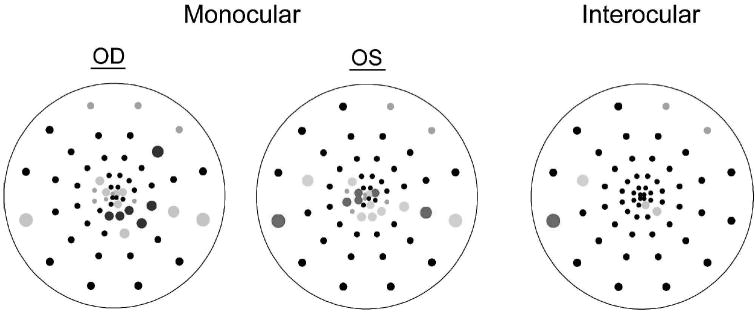
Figure 8.
Monocular and interocular latency probability plots from a control subject. Black circles indicate no significant differences compared to a normative database (monocular plots), or between the two eyes (interocular plot). Colored symbols indicate significantly longer latency in OD (blue) or OS (red) with p<0.01 (saturated) or p<0.05 (desaturated). Gray symbols denote responses that were determined to be too small to measure latency (using criteria described in Hood et al. [20]; Hood et al. [21]).

