
Fig 4. Validation of microarray data.
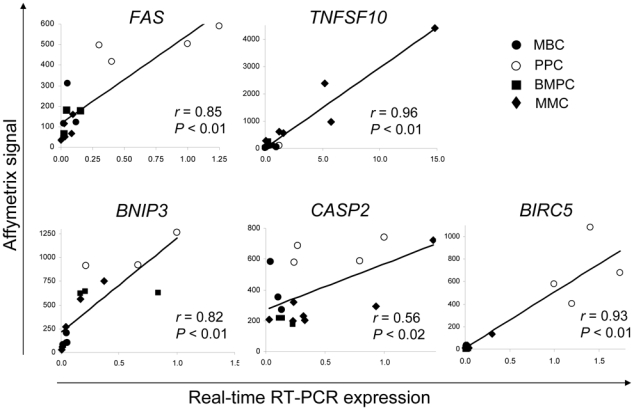
TNFSF10, FAS, BNIP3, CASP2 and BIRC5 were assayed with real-time RT-PCR in MMC samples. The coefficients of correlation and P values for the correlation between Affymetrix and real-time RT-PCR signals were determined with a Spearman test. Black diamonds represent MMC samples (6), open circles are PPC (4), black squares are BMPC (3) and black circles are MBC (3).