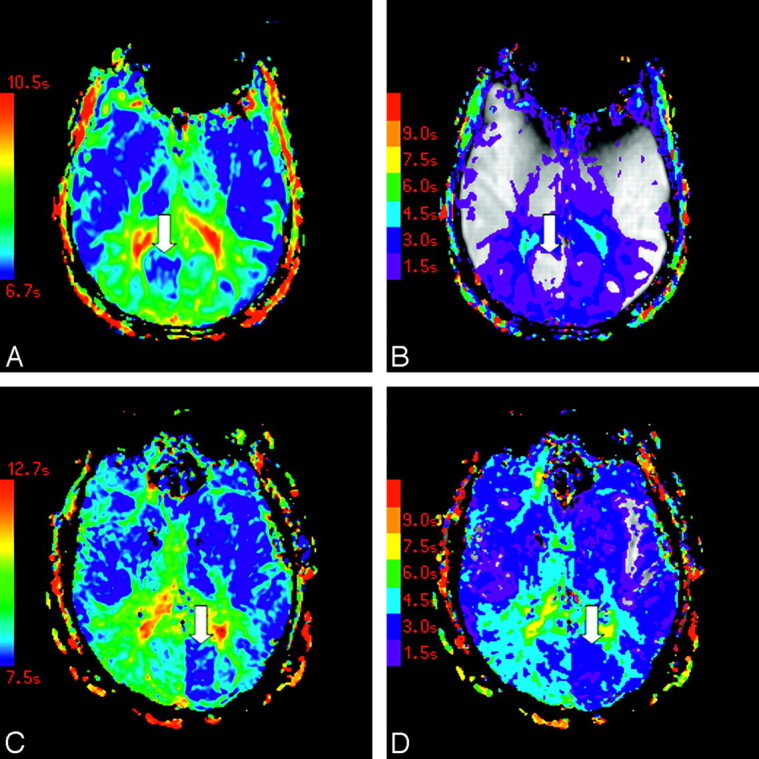
Fig 3.

Color maps of FMT (A) and Tmax (B) in a patient with asymmetry in the minimum PCA territory are shown, as are color maps of FMT (C) and Tmax (D) in a subject with asymmetry in the maximum PCA territory. Arrows indicate areas of asymmetrically faster transit. Tmax maps are displayed at increments of TR, beginning at Tmax = 1.5 seconds (violet) and superimposed on the corresponding precontrast source images.
