Figure 3.
TGF-β Receptors Polarize to Nascent Axons
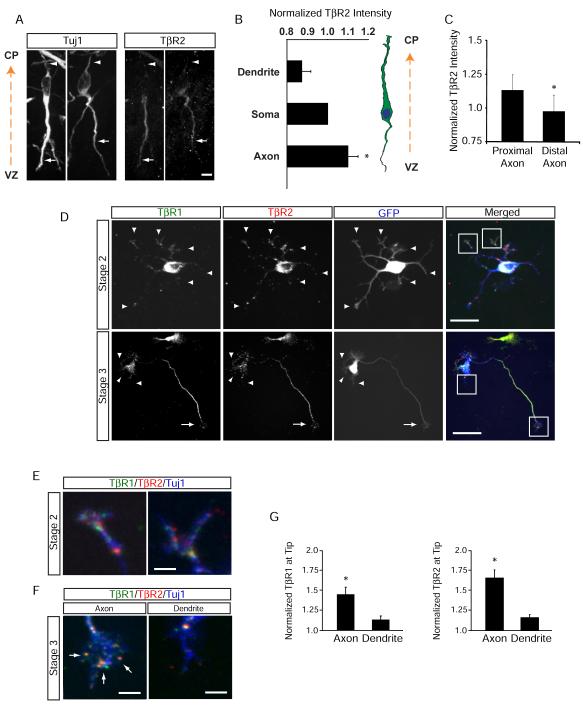
(A) Enrichment of TβR2 in trailing-edge axons (arrows) of Tuj1-positive neurons migrating away from the ventricular zone (VZ) toward the cortical plate (CP) in an E14.5 mouse embryo. Arrowheads indicate the leading-edge dendrite. Scale bar, 20 μm.
(B) Quantitative analysis of TβR2 levels along migrating neocortical neurons. Linescans were performed to measure TβR2 immunofluorescence along the leading edge dendrite, soma, and trailing edge axon, n = 12.
(C) Quantitative analysis of TβR2 levels along axons, n = 12. *p<0.05, Student’s t-test. See Experimental Procedures for details.
(D) Surface-labeled TβR1 and TβR2 in dissociated E18 rat hippocampal neurons show punctate distribution at the tips of all neurites (arrowheads) in stage 2 cells prior to polarization (top panels). A few hours later during axon specification, both TβR1 and TβR2 become polarized to the axon in stage 3 neurons (arrows, bottom panels) while receptor staining is reduced in dendrites (arrowheads, bottom panels). Scale bars are 15 μm for top panels and 20 μm for bottom panels.
(E) Magnified panels demarcated by white boxes in the top right panel of (D) showing surface TβR1 and TβR2 staining at tips of undifferentiated stage 2 neurites. Scale bar, 3 μm.
(F) Magnified panels demarcated by white boxes in the bottom right panel of (D) showing enriched TβR1 and TβR2 within the growth cone of the axon (left, arrows) and loss of surface receptor expression from the growth cone of a dendrite (right). Scale bar, 4 μm.
(G) Integrated intensities of TβR1 (left) and TβR2 (right) immunofluorescence at the distal ends of axons and dendrites of stage 3 neurons. Values were normalized to the shortest neurite in each cell. n = 12 cells. * p<0.05, Student’s t-test.

