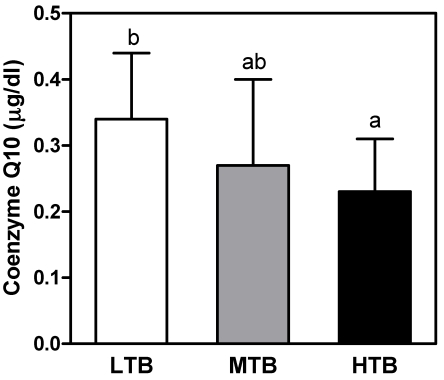
Fig. 2.
Comparison of plasma coenzyme Q10 concentrations according to the tertiles of birth weight in overweight subjects. LTB: Lowest tertile of birth weight, MTB: Mid tertile of birth weight, HTB: Highest tertile of birth weight. Values are mean ± SD. Means with common superscripts indicate that the difference between means is no significant (P < 0.05).

