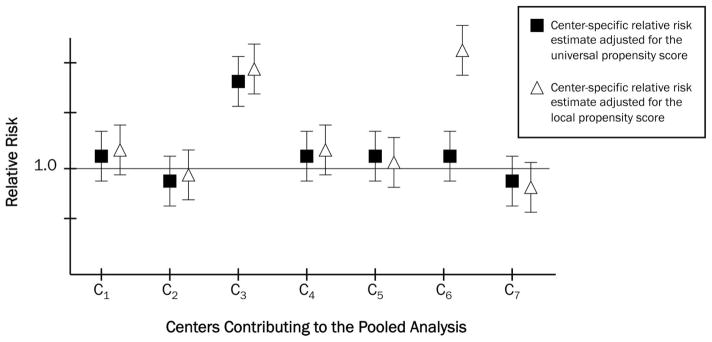
FIGURE 2.
Hypothetical Illustration of 2 types of observed treatment effect heterogeneity: heterogeneity due to differing information content, and heterogeneity due to true differences in treatment effect in study populations. See the text for a description of the universal and local propensity scores. Note that only a universal propensity score was used in the SABER study.

