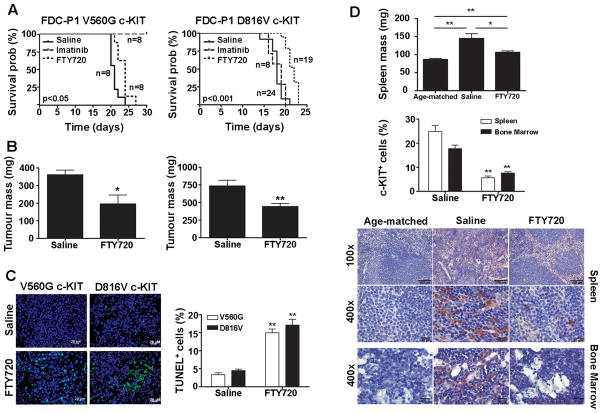
Figure 5. FTY720 delays mutant c-KIT tumor growth in vivo.
FDC-P1 cells expressing either V560G (left) or D816V c-KIT (right) were s.c. inoculated into a separate group of mice. Treatment started day 5 post-tumor injection with daily i.p. injections of saline, 100 mg/Kg imatinib or 10 mg/Kg FTY720. A, The estimated probabilities for survival were calculated using the Kaplan-Meier method, and log-rank test was used to determine the survival difference compared to saline-treated mice. B, On day 14, mice were sacrificed and tumors weighed. Columns, mean of individual tumor weights; bars, SEM. *, p<0.05, n=6. **, p<0.01, n=12, Student’s t-test compared to saline. C, Apoptosis within the V560G and D816V c-KIT tumors assessed by TUNEL staining. Images were acquired at 400x on DAPI (blue) and FITC (green) channels with an Axioplan 2 imaging system. Scale bars, 20 μm. D, Splenic weight (mg) recorded from mice harboring D816V c-KIT tumors on day 14 (top). Columns, mean; bars, SEM. *, p<0.05; **, p<0.01. Immunohistochemical staining of human c-KIT on spleen and bone marrow harvested at day 14 (bottom). Representative pictures were taken with a ColorView II camera and analysis software at 100× and 400× magnification. Scale bars, 100 μm (100×) and 20 μm (400×). The % TUNEL (C) or human c-KIT+ (D) cells were determined by counting the number of positive cells divided by total cells seen in 10 individual fields from 3 different mice. Columns, mean percentage of positive cells; bars, SEM. **, p<0.01, n=3, Student’s t-test compared to saline.

