
Fig 1.
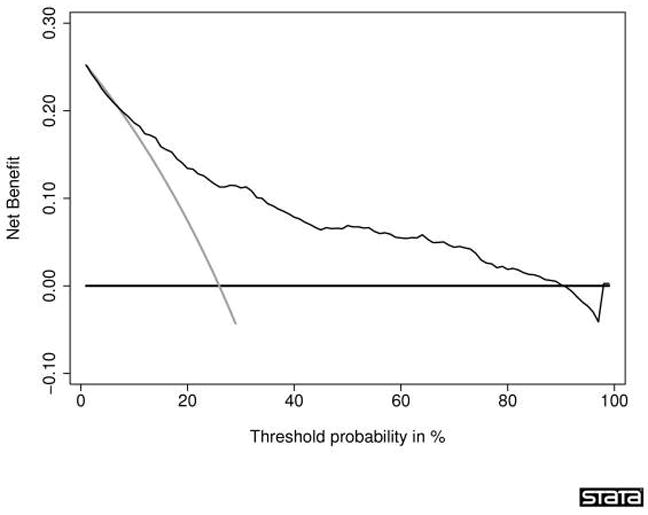
Decision curve for a statistical prediction tool predicting the outcome of prostate biopsy. The thin grey line is the net benefit of biopsying all men; the thin black line is the net benefit of biopsying men on the basis of the statistical prediction tool; the thick black line is the net benefit of biopsying no man. This curve was derived from 740 men undergoing biopsy based on an elevated total PSA. The men had never been previously screened for prostate cancer. Their free PSA was measured and a digital rectal exam was performed. Approximately one-quarter (192) of the men were diagnosed with cancer. Interpretation of the decision curve depends on comparing the net benefit of the test, prediction tool, or marker with that of a strategy of “treat all” (the thin grey line) and “treat none” (parallel to the x axis at net benefit of zero). The strategy with the highest net benefit at a particular threshold probability (pt) is optimal, irrespective of the size of the difference. Determining which men should be biopsied using the statistical prediction tool was superior to biopsying all men with elevated PSA once the threshold probability reached about 10%, and was superior to the strategy of biopsying no man up to a threshold probability of about 90%. To interpret this result, one needs to consider the sort of probability for prostate cancer that men would need before they would decide to have a biopsy. A very risk-averse man might opt for biopsy even if he had only a 10% risk of cancer. However, it seems unlikely that many men would demand, say, a 50% risk of cancer before they had a biopsy; this threshold would imply that an unnecessary biopsy is just as bad as a missed cancer. Reprinted with permission from Vickers et al. [46]