
Figure 5. Activation of STAT3 following MCAO is truncated in aged rats.
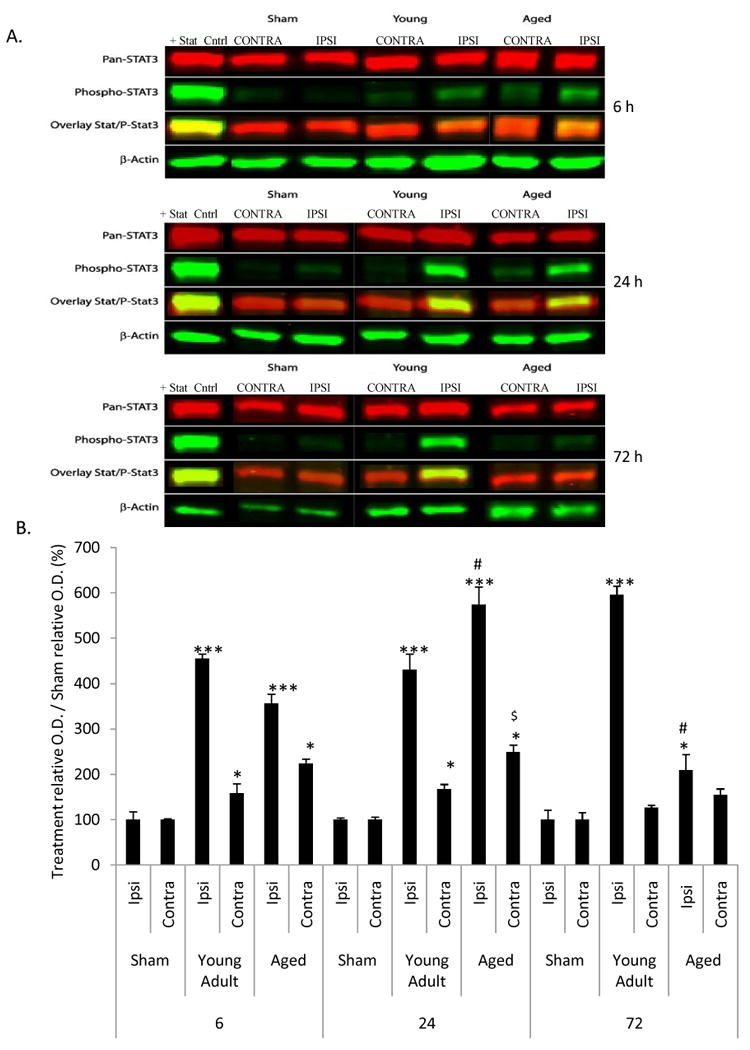
At 6, 24, and 72 h following MCAO, STAT3 and pSTAT3 expression were evaluated quantitatively by immunoblot analysis. Fig 5A shows representative immunoblots for STAT3 and pSTAT3 data. No difference (p>0.05) between basal expression of STAT3 and pSTAT3 expression were noted at any time point. The sham groups on the representative blots were from aged rats. Fig 5B depicts changes in pSTAT3 expression in young adult and aged rats. Bars represent mean ± S.E. (n=3 rats/group). Statistical significance was determined using two-way ANOVA with Tukey's post hoc analysis.*, **, *** denote statistical significance (p<0.05, p<0.01 and p<0.001, respectively) as compared to age-matched sham. # ### denote statistical significance (p<0.05 and p<0.001, respectively) as compared to young adult ipsilateral hemisphere at same time point. $ denotes statistical significance (p<0.05) as compared to young adult contralateral hemisphere at same time point. Total STAT3 remained unchanged as a function of age or MCAO.