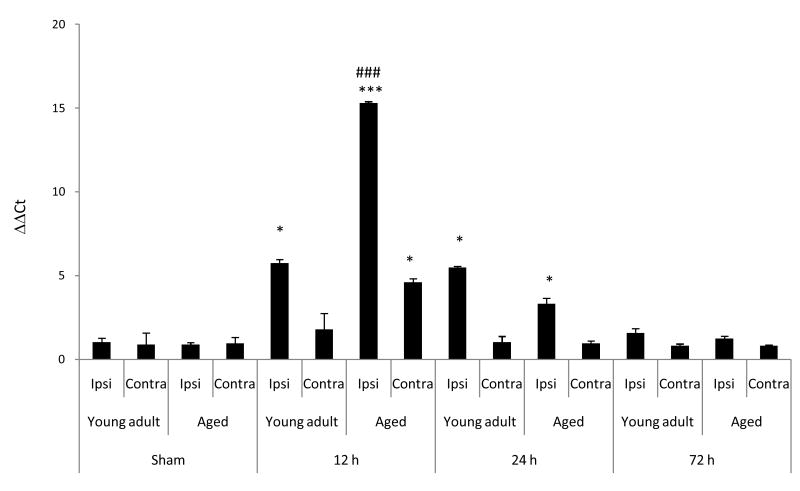
Figure 6. Age enhances the expression of SOCS3 after MCAO.
At 12, 24, and 72 h following MCAO, changes in SOCS3 mRNA expression in young adult and aged rats were measured using real-time PCR. Results are calculated from ΔΔCT and signify fold change in mRNA expression normalized to age-matched naïve rats. Bars represent mean ± S.E. (n=4 rats/group). No difference (p>0.05) in SOCS3 mRNA expression was observed in sham rats of either age at the three time points; thus, only sham rats at 24 h were displayed. Statistical significance was determined using two-way ANOVA with Tukey's post hoc analysis. *, *** denote statistical significance (p<0.05 and p<0.001, respectively) as compared to age-matched sham. ### denotes statistical significance (p<0.001) as compared to ipsilateral hemisphere of young adult rats following MCAO at same time point.

